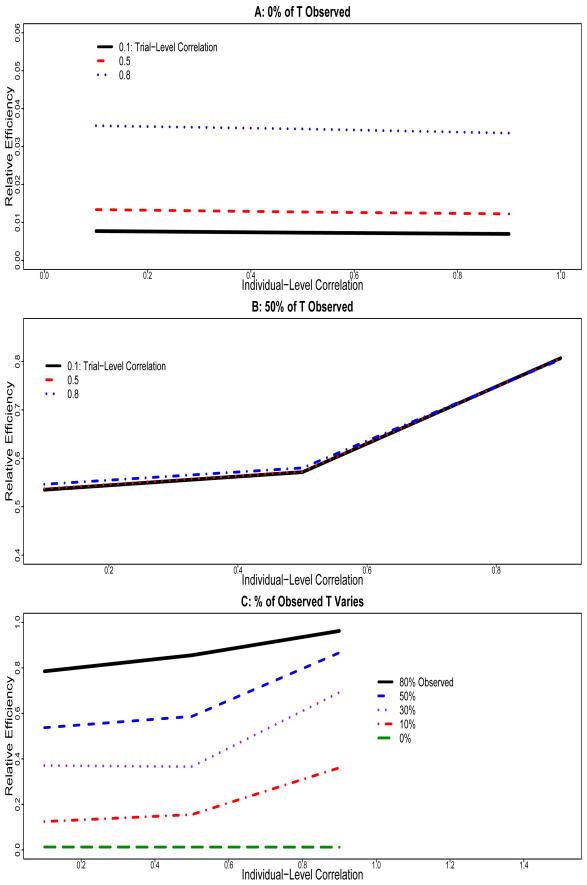
Figure 1.
Simulation results based on 500 data sets. Relative efficiency of the new treatment effect estimate using S when T is not completely observed to that when T is completely observed. A: 0% of T Observed in the new trial; B: 50% of T observed in the new trial; C: Percentage of Observed T Varies in the new trial.

