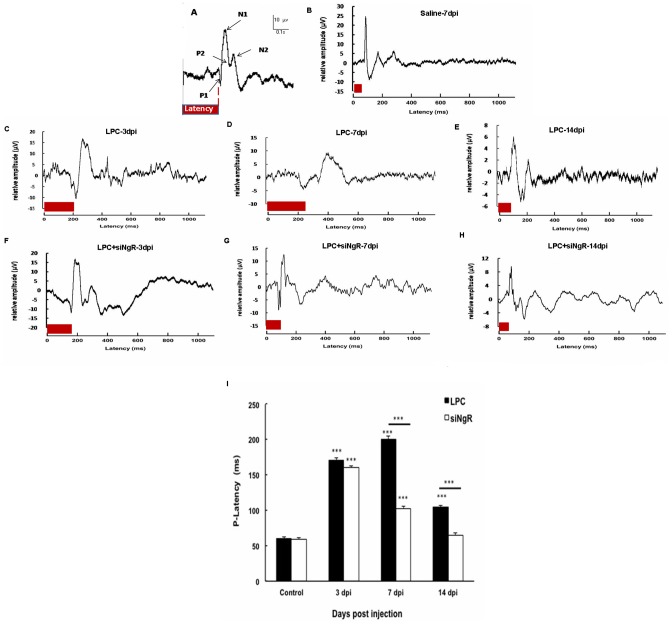
Figure 4. Functional recovery is induced by NgR inhibition in demyelinated optic chiasm.
(A) Visual evoked potential (VEP) sample recordings from electroencephalographic activity and its components. The trace represented is the average of 300 sweeps of 300 ms duration with 1 Hz frequency. P1 latency (red bar) was measured by Biochart software. (B) VEP sample from animals treated with saline inside the chiasm (control) recorded at 7 dpi. (C–E) Changes in the P1 wave latency at 3, 7 and 14 dpi in the LPC treated animals. (F–H) VEP sample recordings from LPC+siNgR treated animals at 3, 7 and 14 dpi. (I) Quantitative analysis of changes in P1 latency in different groups. Statistical analysis used two-way ANOVA with Bonferroni's post-test. Treatment and time had a significant effect in this study. In LPC treated animals P1- latency was increased at 3, 7 and 14 dpi compared to control (all, ***p<0.001) but was partially diminished at 14 dpi (E). In LPC+siNgR group, there was a significant increase in p-latency at 3 and 7 dpi compared to control (both, ***P<0.001). NgR inhibition induces functional recovery at 7 and 14 dpi compared to LPC 7 and LPC 14, respectively (both, P<0.001) and there was no significant change in p-latency between LPC+siNgR and Control at14 dpi. Data was pooled from three independent experiments on mice (n = 6), Bars: Mean ± SEMs.

