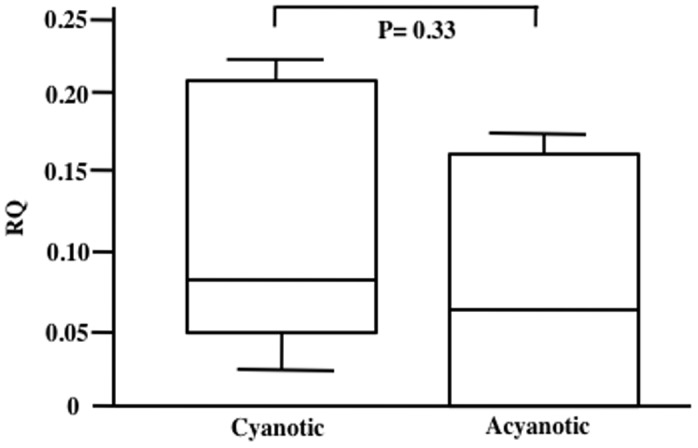
Figure 2. APJ receptor analysis for cyanotic and acyanotic groups.

Comparison of myocardial APJ receptor mRNA for the cyanotic (n = 7) and acyanotic (n = 5) patient groups shown in Table 2. Expression was calculated using the Comparative Ct method to give RQ of gene expression using the StepOne Software v2.1). Statistical analysis was performed using the Mann-Whitney U test. Data shown as box and whiskers plot.
