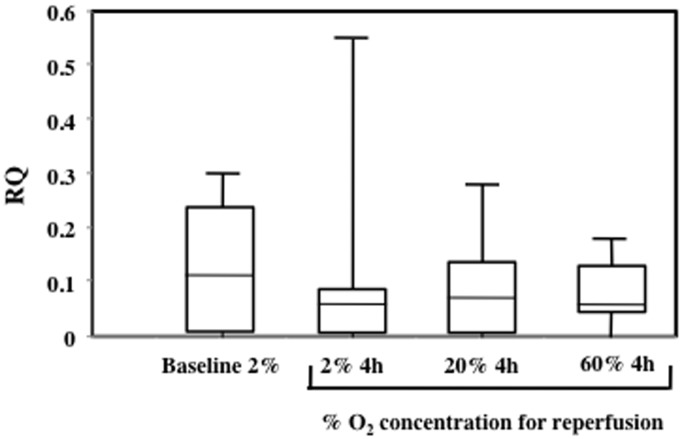
Figure 3. Comparison of myocardial APJ receptor mRNA for samples collected from patients shown in Table 3 then re-perfused at 2, 20 or 60% O2 for 4 h.
Baseline are samples analysed before the re-perfusion experiments started. Expression was calculated using the Comparative Ct method to give RQ of gene expression using the StepOne Software v2.1). Statistical analysis was performed using the Mann-Whitney U test. Data shown as box and whiskers plot.

