
Figure 2. Meta-analysis of the forest plot showing the association between the genome-wide DNA hypomethylation and the overall cancer survival.
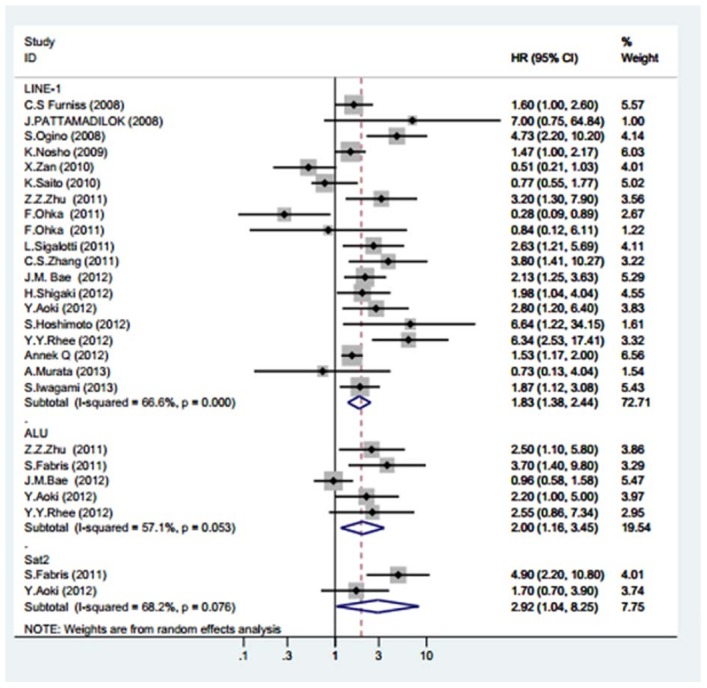
The squares represent the size of the study and are centred on the HR, and the whiskers represent the 95% CIs. A random effects (RE) model was used.