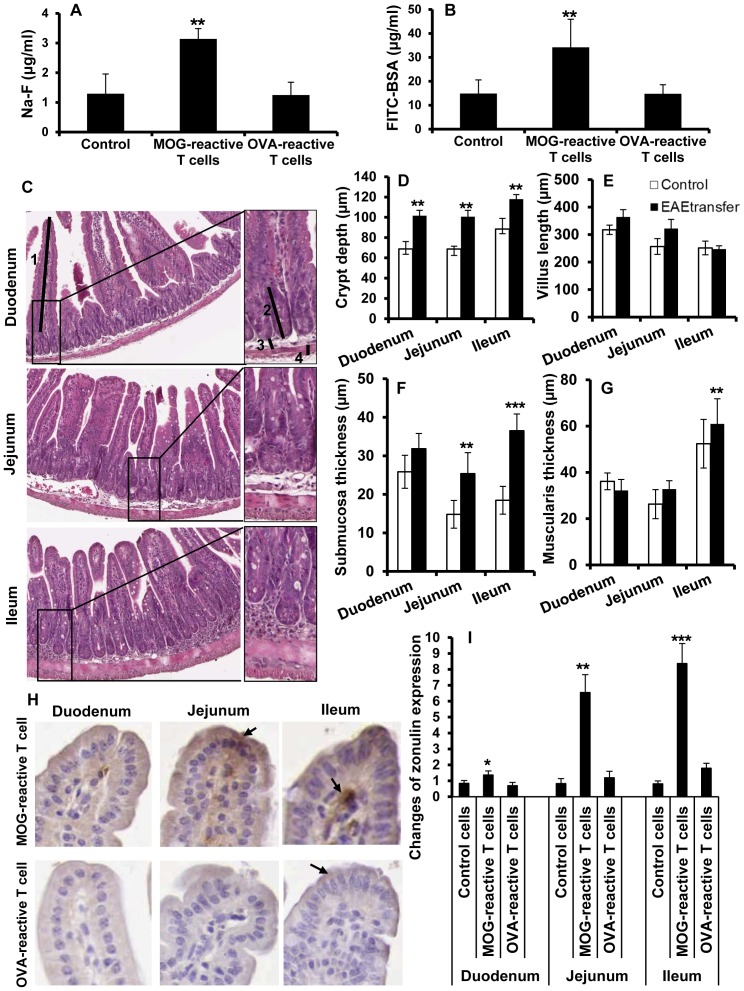
Figure 6. Increased intestinal permeability and altered intestinal morphology after adoptive transfer of encephalitogenic T cells.
Na-F (A) , FITC-BSA (B) in plasma from mice receiving un-stimulated lymph node cells (Control), MOG-reactive T cells (adoptively transferred EAE) and OVA-reactive T cells, (n = 3–5). Mice were gavaged with a marker molecules as described in Figure 1. H&E-sections from duodenum, jejunum and ileum isolated from animals receiving MOG-reactive T cells (EAETransfer) (C). The sections were examined for crypt depth (D), villus length (E), submucosa (F) and muscularis thickness (G). Arrows demonstrate approximate measurements for villus length (1) crypt depth (2) submucosa thickness (3), muscularis thickness (4) and highlight the differences between the groups (C, original magnification ×40, insets ×100). Each bar represents mean ±SD of 7–9 analyzed sections per animal, (n = 5). Immunohistochemical analysis of zonulin expression from mice receiving MOG-reactive and OVA-reactive T cells (H). Arrows show zonulin both in enterocytes and lamina propria on top of the villi. Semi-quantitative analysis of zonulin staining (I). Staining intensity was expressed as positive pixels/mm2 and converted as ratio to the mean values from relevant sections in the control animals. Data shown are mean ±SD from 3–5 animals for each group. ** represents a p-value≤0.01 and *** a p-value≤0.001.

