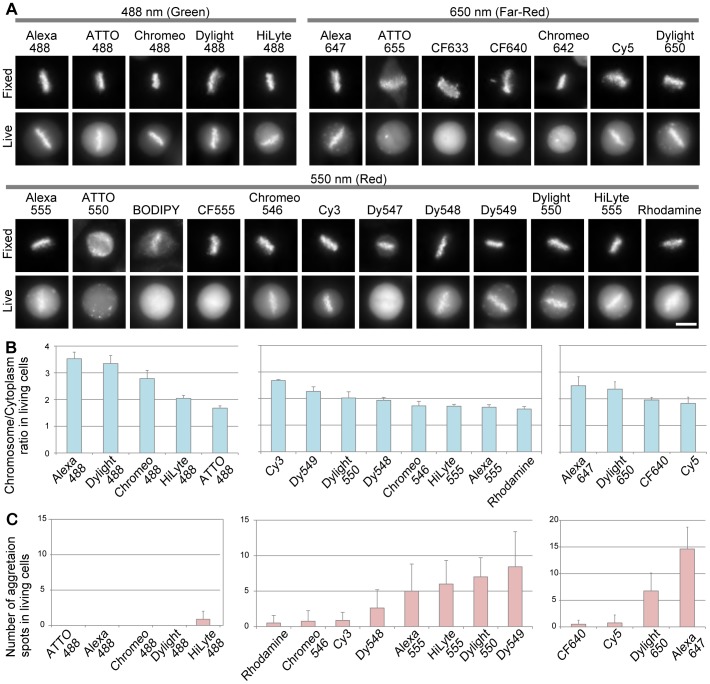
Figure 3. Distribution of Fab315 conjugated with different fluorescent dyes in fixed and living cells.
(A) Representative images of mitotic cells stained or loaded with dye-labeled Fab315. HeLa cells were fixed, permeabilized, and stained (top rows; Fixed) or loaded (bottom rows; Living) with Fab315 conjugated with different dyes. Fluorescence images of metaphase cells where chromosomes were aligned in the middle were collected 4–6 h after loading. Most dye-labeled Fab315 highlighted chromosomes in fixed cells with low background. In living cells, some were concentrated on chromosomes and others were not. Bar 10 µm. (B) Enrichment of dye-labeled Fab315 in mitotic chromosomes in living cells. Using images like those shown in (A), fluorescence signal intensities in chromosome and cytoplasm areas were measured, and the chromosome∶cytoplasm intensity ratios were plotted (averages with s.d.; n = 6–7). The dyes showing higher chromosome∶cytoplasm ratios are suitable for live imaging. (C) The number of cytoplasmic spots. z-stack fluorescence images (6 stacks; 1 µm intervals) of cells in metaphase were collected and maximum intensity projection images were analyzed. Cytoplasmic spots were detected with a help of edge highlighting, and the numbers were counted and plotted (averages with s.d.; n = 6–7). The number of spots may be underestimated because projected images were analyzed, but this information is still useful for the comparison among different dyes. The dyes with lower number of spots are suitable for live imaging.

