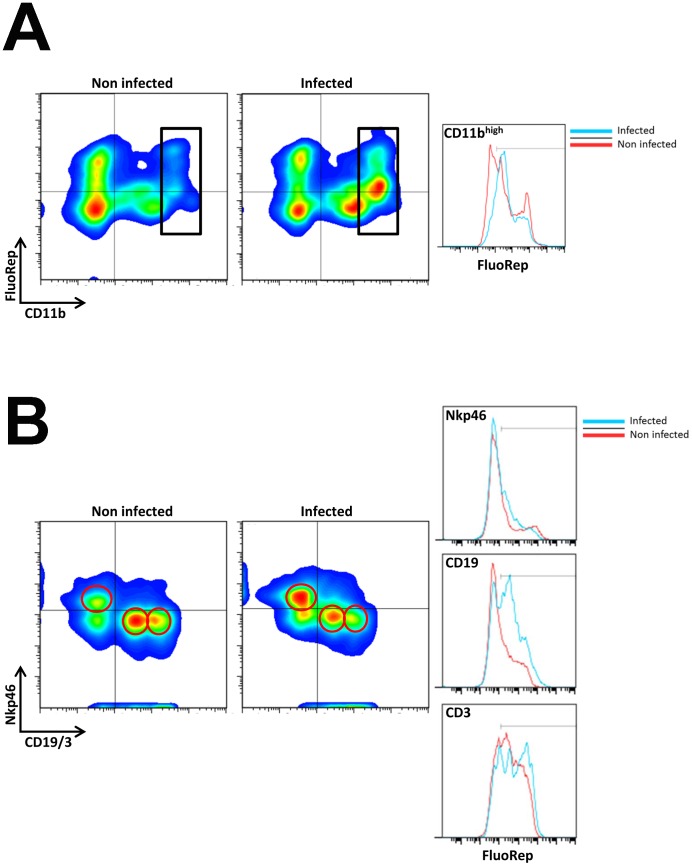
Figure 3. Flow cytometric analysis of immune cells in the lung revealed LacZ reporter gene expression in macrophages and lymphocytes.
Cells were prepared from lungs of naïve and PR8 infected (2×10⁵ FFU) female mice (3dpi). Different immune cell populations were identified by gating on the respective positive population: CD11bhigh cells (macrophages) were discriminated within the leucocyte population as depicted in (A). Lymphocytes were distinguished by using αNKp46 (NK cells), αCD3 (T cells) and αCD19 (B cells). Antibodies staining CD19 and CD3 were labeled with fluorochromes APC and Alexa 647, respectively. They were detected in the same channel forming distinct populations as verified by independent staining (data not shown). The left population in the lower right quadrant represents αCD19-APC with lower fluorescence intensity whereas the CD3 positive population is reflected in the right population with higher fluorescence intensity (B). All immune cell populations as indicated by gates in the density plots exhibited a distinct expression of the LacZ reporter gene. Red circles represent the respective gated cell populations. FluoRep: staining intensity using fluorescein di β-D-galactopyranoside (FDG) as substrate for ß-galactosidase (see Material and Methods for details). Red line in histograms indicates cells from naïve, blue line from infected mice. For group size, see Table 1.

