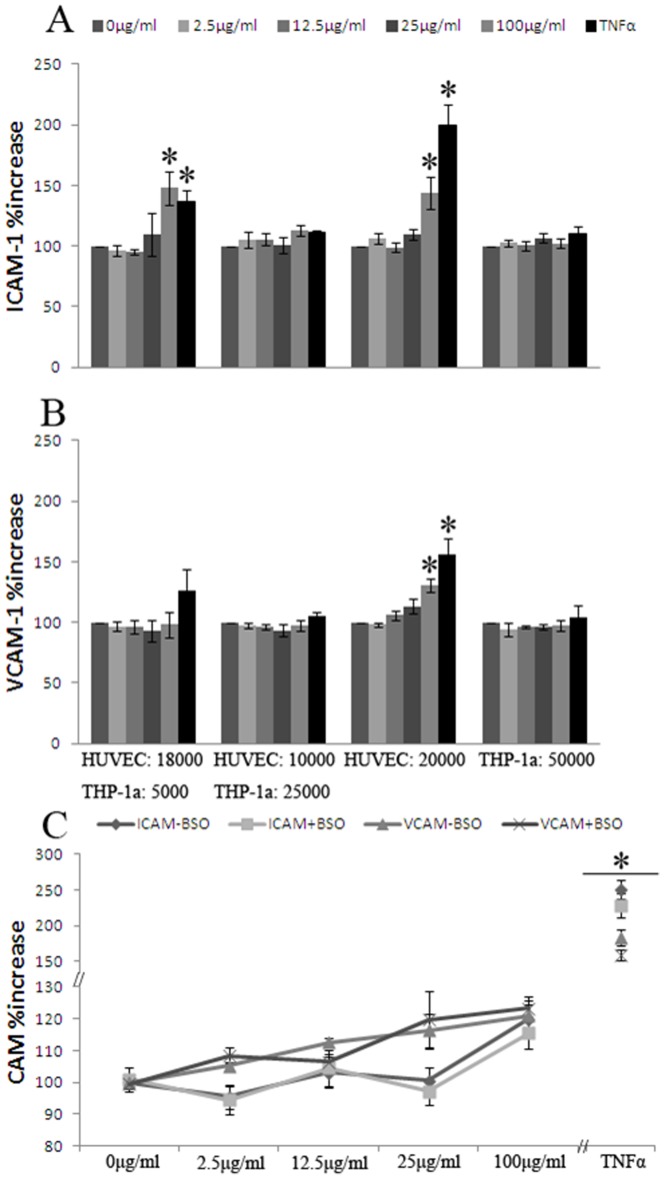
Figure 5. ICAM-1 and VCAM-1 surface expression after 24 h CB exposure in mono-cultures of HUVECs or THP-1a cells, co-cultures with 90% HUVECs and 10% THP-1a cells or 50% HUVECs and 50%THP-1a cells with number of seeded cells indicated (A and B) and effect of BSO pre-treatment on ICAM-1 and VCAM-1 surface expression in HUVECs (C).
Data are expressed as percentage of absorbance of unexposed control cells and bars are means ±SEM of at least three independent experiments. *P<0.05 compared with unexposed cells.

