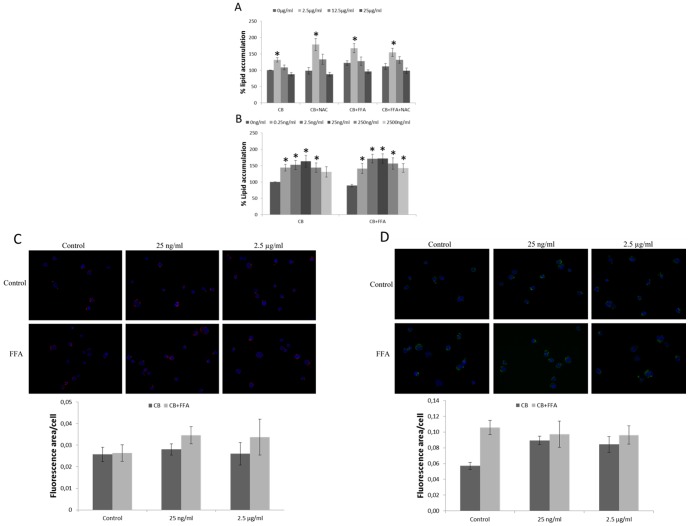
Figure 7. Accumulation of lipids in THP-1a cells after 24 h exposure to CB with or without the presence of NAC (A) or lower concentrations of CB (B) and subsequently treated with free fatty acids (FFA) for 3 h.
Data are expressed as percentage increase of lipid accumulation compared with unexposed control cells and bars are means ±SEM of 4–10 independent experiments. *P<0.05 compared with unexposed cells. Semi-quantitative determination of lipid accumulation were performed by microscopy with Nile Red and Bodipy 493/503: C) Cells are stained with Nile Red (red) and Hoechst (blue), D) Cells are stained with Bodipy 493/503 (green) and Hoechst (blue) and representative images are shown in top, and calculation of the lipid fluorescence area per cell shown below calculated from 5 independent areas with SEM.

