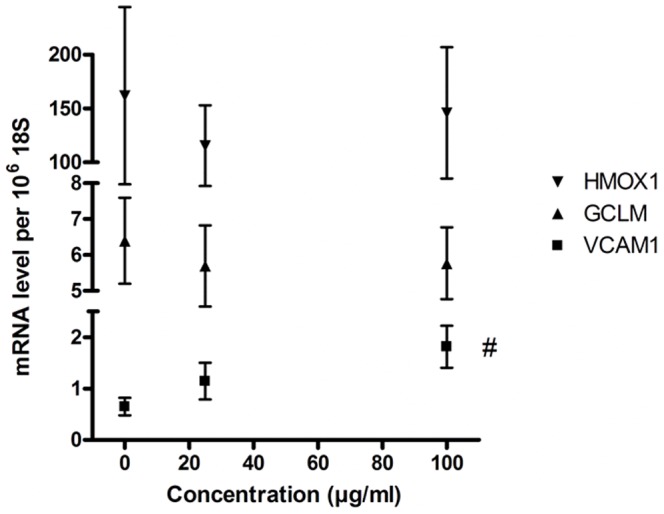
Figure 8. mRNA expression of GCLM, HMOX1 and VCAM1 in HUVECs after exposure to CB for 3 h.

The symbols represent the mean and SEM of three independent experiments. #P<0.05 (linear regression analysis).

The symbols represent the mean and SEM of three independent experiments. #P<0.05 (linear regression analysis).