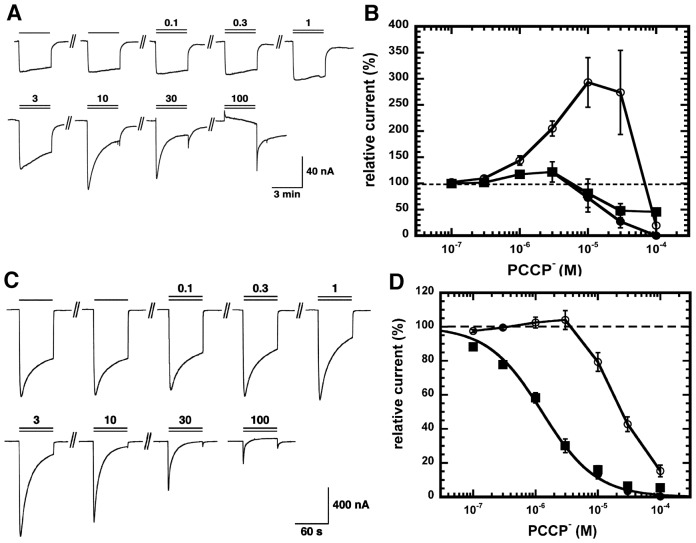
Figure 3. Effect of PCCP− on recombinant α1β2γ2 GABAA receptors.
A, GABAA receptors were expressed in Xenopus oocytes. The electrical currents recorded by two-electrode voltage clamp were activated with a concentration of GABA eliciting 1% of the maximal current amplitude (EC1) and inhibited with increasing concentrations of PCCP−. The lower bar indicates the time of GABA application, the upper bar the time of PCCP− application. The numbers indicate the concentration of PCCP− in µM. At concentrations >1 µM, induces an open-channel block, characterized by an apparent desensitization of the current and an off-current. B, Averaged concentration inhibition curve by PCCP−. Individual curves were fitted and standardized to the current elicited by GABA. Data are shown as mean ± SEM (n = 4). Open circle: peak current amplitudes at the beginning of the drug application. Filled squares: current amplitudes at the end of the drug application. Filled circles: current amplitudes at the end of the drug application corrected for the direct effect of PCCP− on membranes. C) and D) same experiment carried out at a concentration of GABA eliciting 10% of the maximal current amplitude (EC10).

