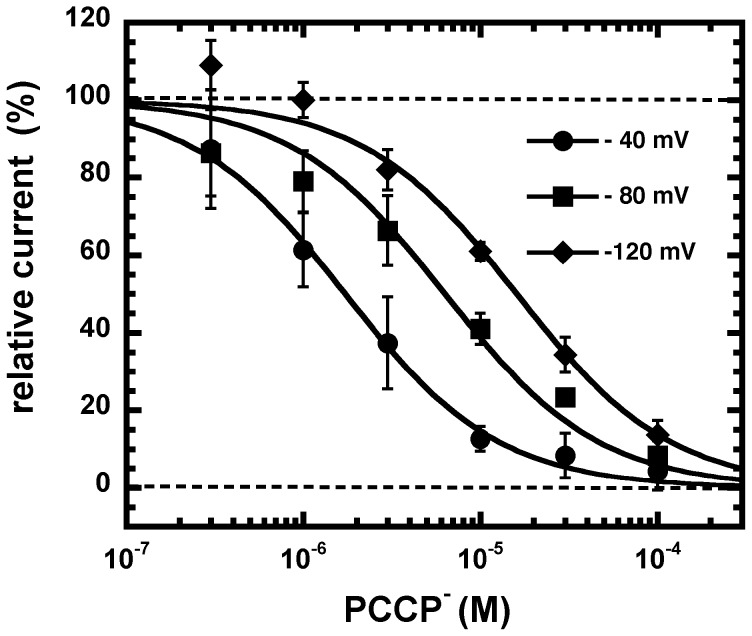
Figure 5. Effect of the membrane potential on inhibition by PCCP−.
A, GABAA receptors were activated with a concentration of GABA eliciting 10% of the maximal current amplitude (EC10) and inhibited with increasing concentrations of PCCP−. Averaged concentration inhibition curves by PCCP− are shown for different membrane potentials. Individual curves were fitted and standardized to the current elicited by GABA. Data are shown as mean ± SD (n = 3).

