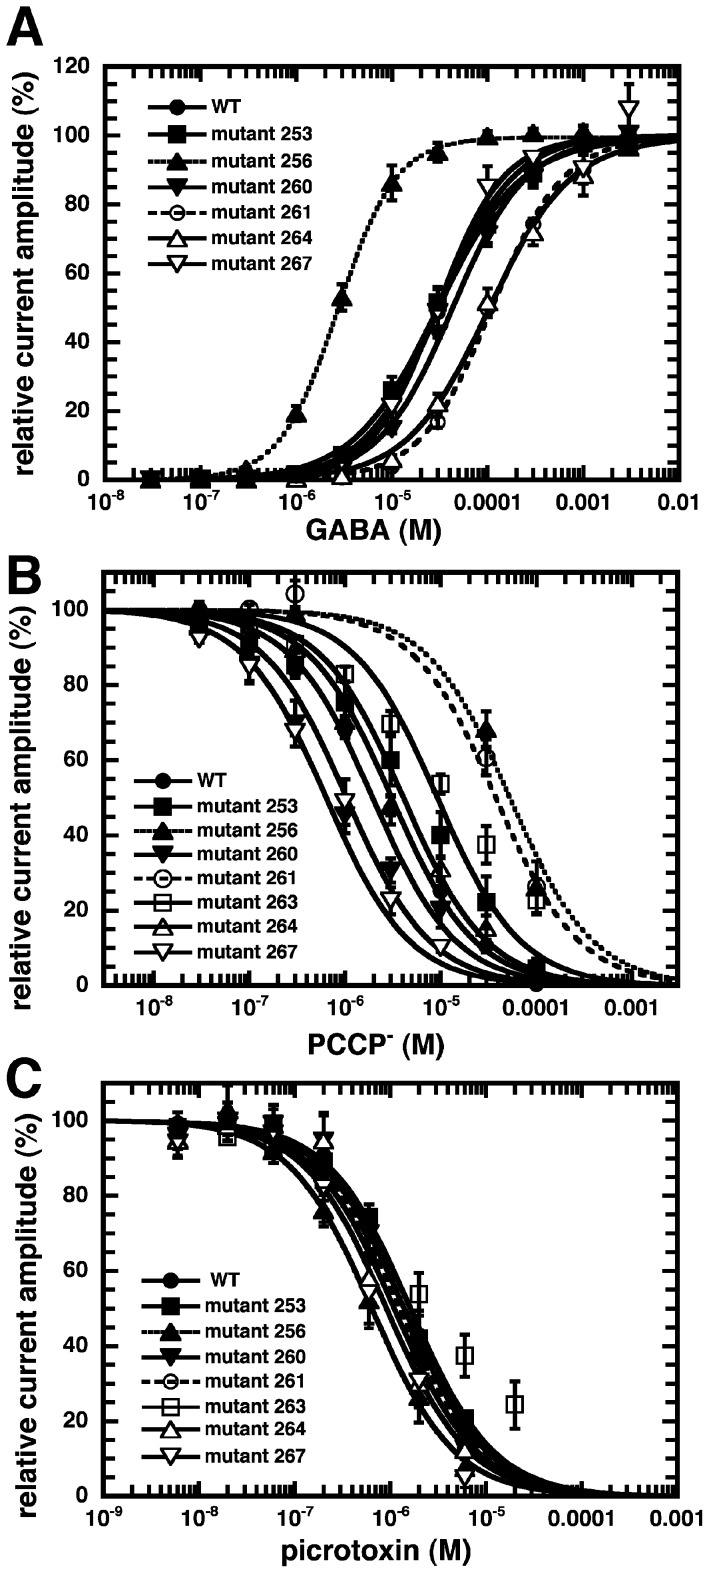
Figure 7. Pharmacological properties of wild type and cysteine mutant GABAA receptors.
A, GABA concentration response curves from wild type and mutant rat GABAA receptor. B, PCCP− and C, picrotoxin concentration inhibition curves. Individual curves were fitted and standardized. Data are shown as mean ± SD (n = 3 to 4).

