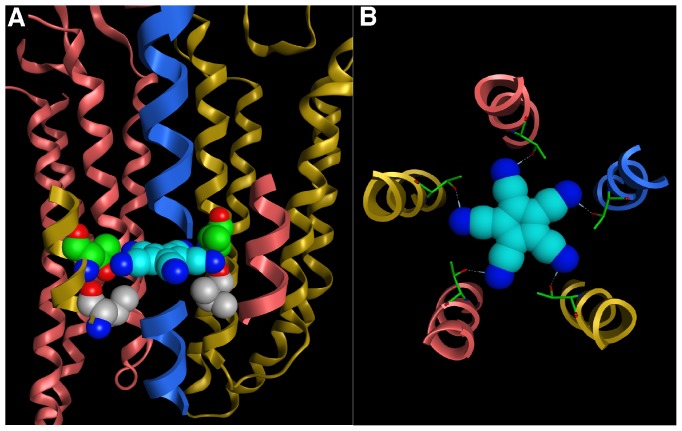
Figure 12. Molecular model of the interaction of PCCP− with GABAA receptors.
A, The side view of the PCCP− docking pose from the perspective of the γ2 subunit. The ligand and the mutated residues of the α1 subunit, which have an impact on the affinity of the ligand, are shown in space filling representation. The 2′ valines of the α1 subunit are rendered grey; the 6′ threonines of the α1 subunit in green. The GABAA receptor is displayed in ribbon representation with α1 subunits shown in yellow, β2 subunits in red, γ2 subunit in blue. The complete transmembrane domain (TMD) is shown only of the α1 and the β2 subunits in the back. Of the subunits in front, only a segment of the transmembrane domain 2 (TMD2) is depicted. The TMD2 of the γ2 subunit is only partly displayed to provide a “window” through which the ligand is seen. B, Top view of the pose showing the symmetric molecular interactions between ligand and receptor. PCCP− (space filling) forms H-bonds (blue dashed lines) to the –OH groups of the 6′ threonines (stick representation) of each of the five subunits.

