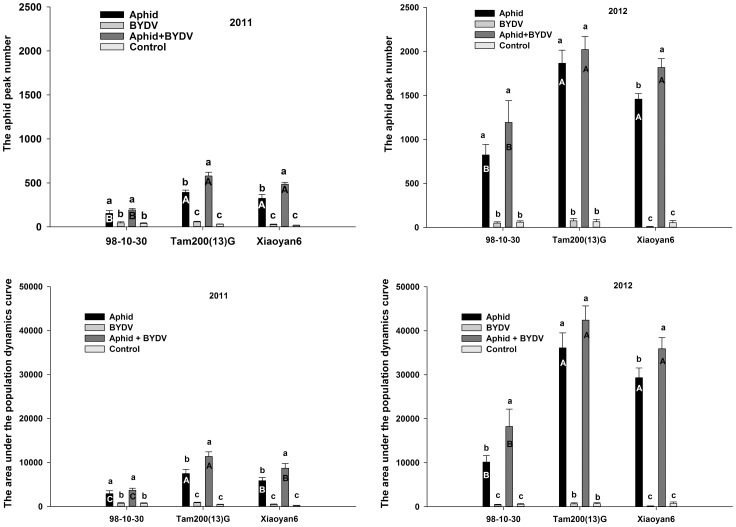
Figure 2. The aphid peak number (APN) and the area under the curve of population dynamics (AUC) on three wheat varieties treated with S. avenae infestation, BYDV infection alone or jointly (mean ± SD).
Note: APN and AUC both were significantly different among three wheat varieties (2011: pAPN = 0.006, pAUC<0.001; 2012: pAPN = 0.014, pAUC<0.001); among four treatments (pAPN and pAUC all less than 0.001 in both years); and interactions between varieties and treatments (2011: pAPN = 0.001, pAUC<0.001; 2012: pAPN = 0.001, pAUC<0.001). Different little letters above the bar indicate the significance of differences according to treatment for same variety. Different capital letters in the bar indicate the significance of differences according to varieties for same treatment (p<0.05).

