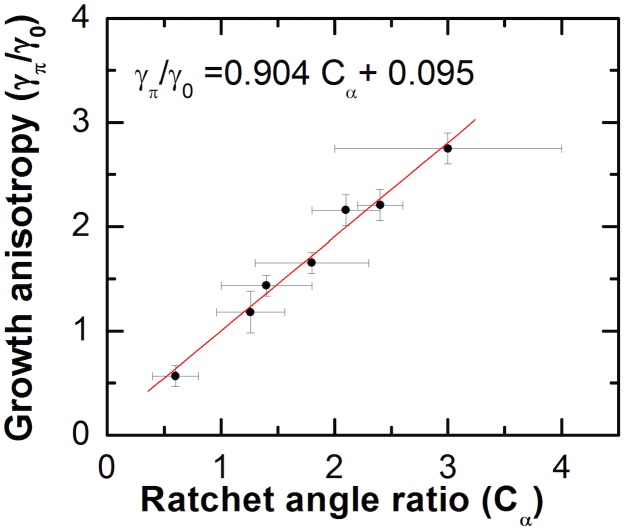
Figure 5. Cell-surface coupling versus ratchet asymmetry.
Variation in the strength of the cell-surface coupling asymmetry γπ/γ0 with increasing ratchet asymmetry Cα for all 7 types of surfaces measured in the current study. Error bars for the ratchet angle ratios Cα represent experimental uncertainties obtained from the standard deviations of measured ratchet angles via AFM. Error bars for the coupling asymmetry γπ/γ0 represent uncertainties obtained from the fit of the normalized angular distributions with Eq. 3.

