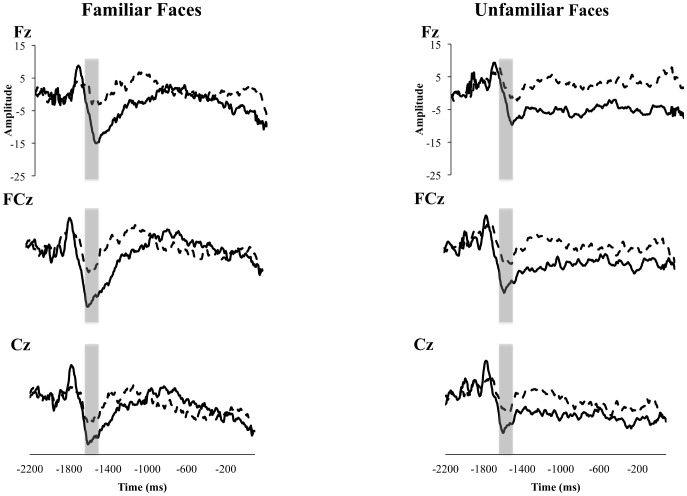
Figure 3. Grand averaged waveforms for both groups from the Nc component prior to familiar and unfamiliar faces.
TD children are represented with a solid line, and children with ASD with a dashed line. The area between −1700 and −1550 ms, used for statistical analyses, is highlighted with a grey box.

