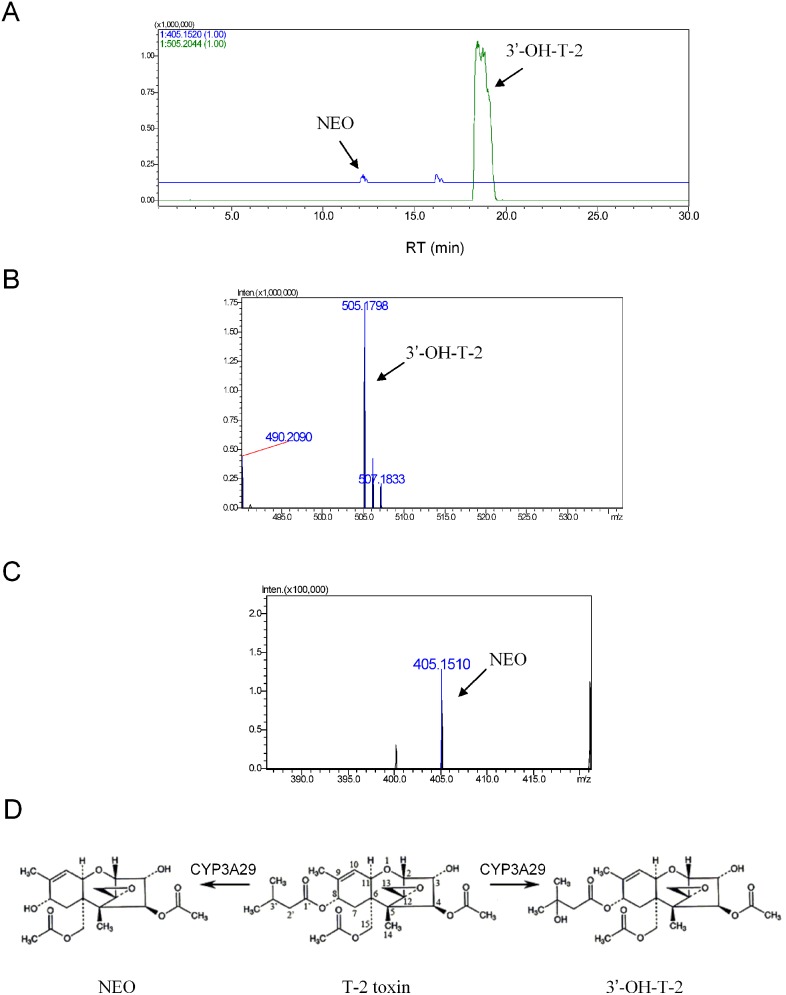
Figure 3. Identification of the metabolites of T-2 toxin after incubation with recombinant CYP3A29.
(A) Accurate extracted ion chromatograms of the metabolites of T-2 toxin after incubation with CYP3A29. (B) Accurate MS spectrum of 3′-OH-T-2. (C) Accurate MS spectrum of NEO. (D) Structural illustration of the metabolites of T-2 toxin metabolized by CYP3A29.

