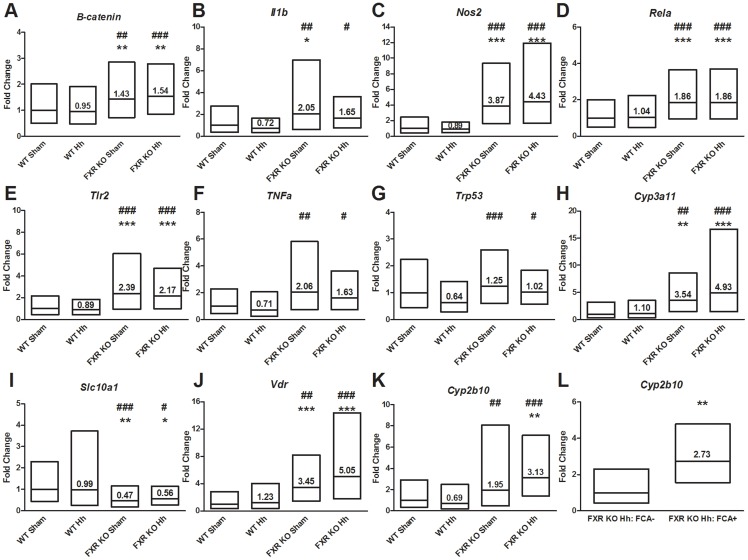
Figure 3. Gene expression changes associated with H. hepaticus infection and the absence of FXR.
Fold changes of A-G) pro-inflammatory (β-catenin, IL-1b, Nos2, Rela, Tlr2, TNFα, and Trp53) and H-K) metabolic (Cyp3a11, Slc10a1, Vdr, and Cyp2b10) genes determined by qPCR are shown for each group relative to WT sham mice. L) Cyp2b10 expression in infected FXR KO mice is shown based on FCA presence vs. absence (P = 0.0028). Box plots represent the average fold change relative to WT sham ±1 standard deviation. Values represent average fold change relative to uninfected WT sham. *P<0.05, **P<0.01, ***P<0.001 vs. sham-treated WT mice. # P<0.05, ## P<0.01, ### P<0.001 vs. H. hepaticus infected WT mice.

