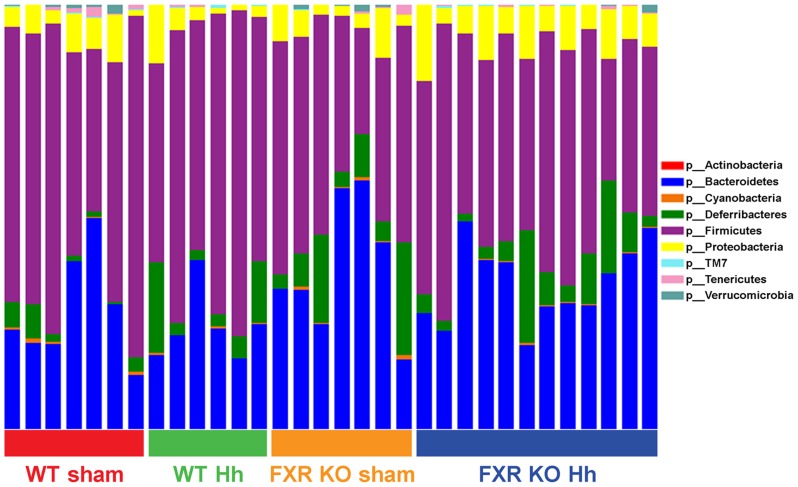
Figure 5. Microbiome composition by phylum.
Individual bars represent individual mice from four groups (WT sham, WT H. hepaticus, FXR KO sham and FXR KO H. hepaticus). There is a significant decrease (P<0.05, FDR <5%, ANOVA) in the phylum Firmicutes in all FXR KO mice compared to all WT mice (46.3% in FXR KO compared to 61.5% in WT).

