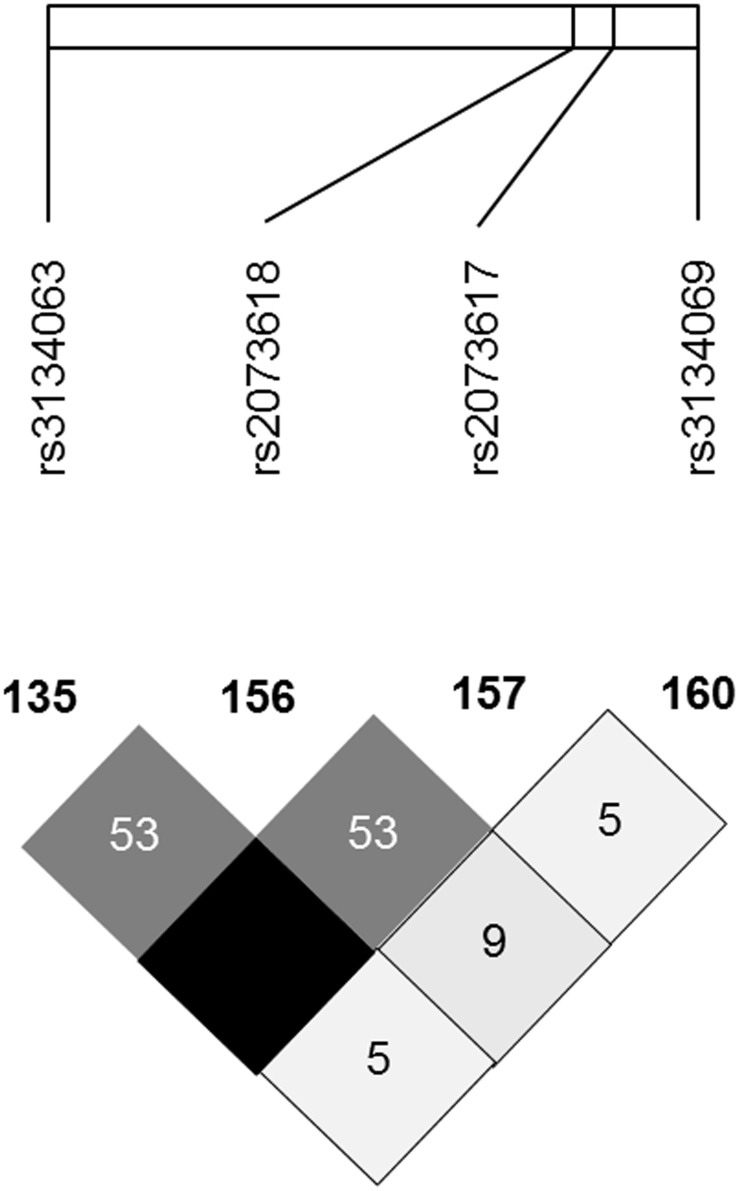
Figure 1. Linkage disequilibrium (LD) pattern of the OPG polymorphisms analyzed in our study (in European population).
Data obtained by HapMap Project phase I, II and III and HAPLOVIEW (v.4.2) software. The LD between the OPG polymorphisms studied is shown in a scale from minimum (white) to maximum (black).

