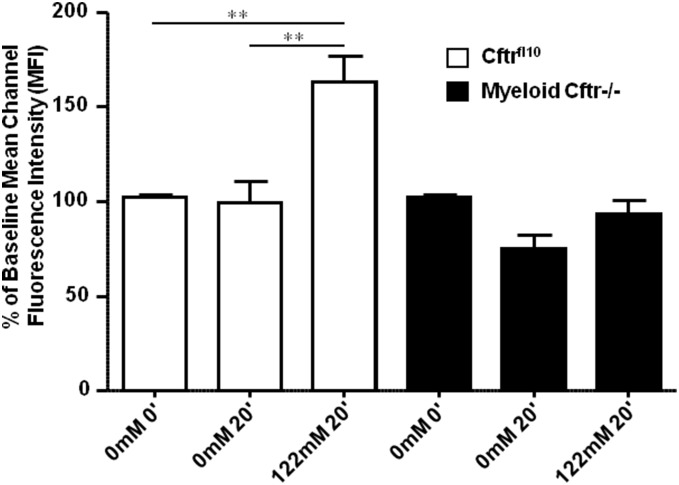
Figure 3. Impairment of phagosomal HOCl production in neutrophils from Myeloid Cftr−/− mice.
Neutrophil production of HOCl was assessed using the fluorescent HOCl probe R19-S. Phagocytosis was performed by mixing neutrophils with opsonized PsA in the chloride-free buffer (0  ) for 15 min, and the cells were further incubated in the buffer containing either 0 mM or 122
  for 20 min. Then, R19-S was added to incubate for an additional 15 min. Fluorescence of R19-S produced by HOCl oxidation was analyzed by flow cytometry. Mean fluorescence intensity (MFI) of each sample was obtained and compared to their 0-min time point. Statistical difference was judged by Student’s t-test. Double asterisks indicate significant differences (p<0.01, n = 4).

