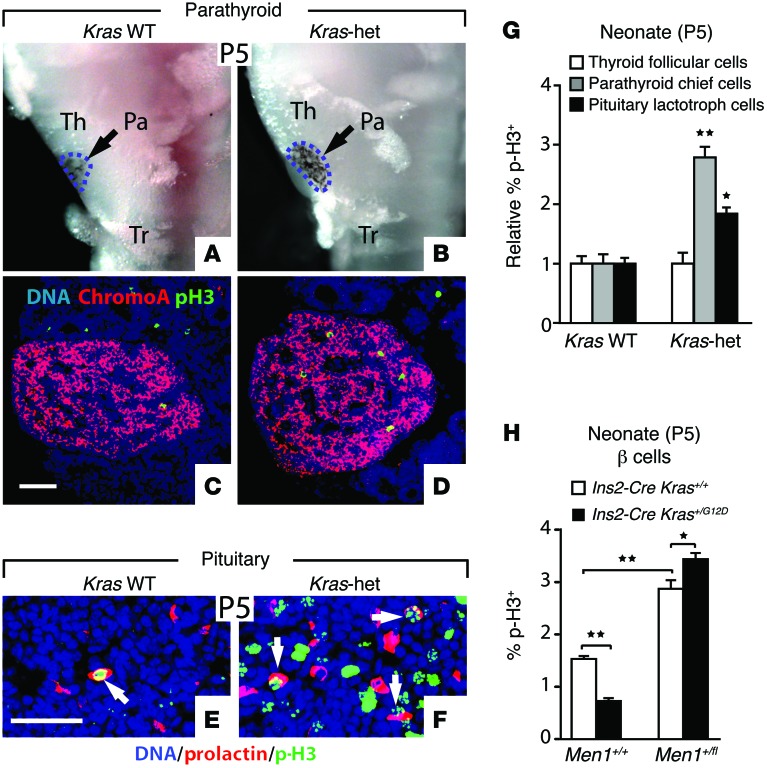
Figure 4. Endocrine proliferation in menin-sensitive tissues.
(A and B) Ventral views of microdissected tissue from P5 neonates show the trachea (Tr), thyroid (Th), and parathyroid (Pa, outlined by intercalated black melanocytes). (C and D) Sections from P5 parathyroid glands were immunostained for the endocrine marker chromogranin A and p-H3. (E and F) Sections from P5 pituitary glands were immunostained for prolactin and p-H3. Proliferating lactotrophs are indicated with white arrows. (G) Normalized proliferation rates of the indicated cell types from P5 embryos were assessed by p-H3 staining (n = 6 Kras WT, n = 6 Kras-het, >6,000 chief cells, >3,000 lactotrophs, >14,000 thyroid follicular cells counted in total). (H) The percentage of β cells expressing the proliferation marker p-H3 was quantified in pancreata from P5 neonatal mice of the indicated genotypes (n = 4–5 for all genotypes, >34,000 β cells counted in total). All data points represent the mean ± SEM. *P < 0.05, **P < 0.01 versus control (G) or for the comparisons indicated by 2-tailed Student’s t test. Scale bars: 50 μm.

