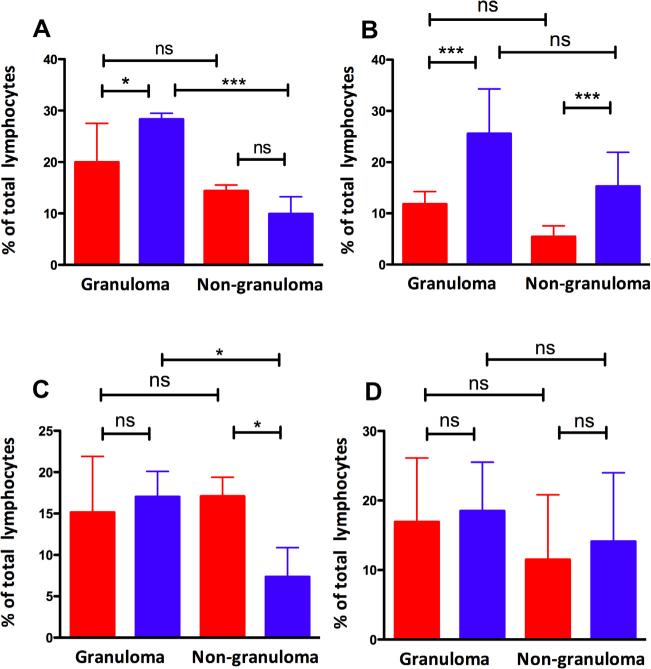
Fig. 4.
CD4+ T cells expressed as a % of total lymphocytes are shown for lung (granuloma as well as non-granuloma) samples on the Y-axis for BCG-vaccinated (red) and sham-vaccinated (blue) NHPs at both 5 (A) and 10-week (B) post-Mtb infection. CD8+ T cells expressed as a % of total lymphocytes are shown for lung (granuloma as well as nongranuloma) on the Y-axis for BCG-vaccinated (red) and sham-vaccinated (blue) NHPs at both 5 (C) and 10-week (D) post-Mtb infection. (For interpretation of the references to color in this figure legend, the reader is referred to the web version of this article.)

