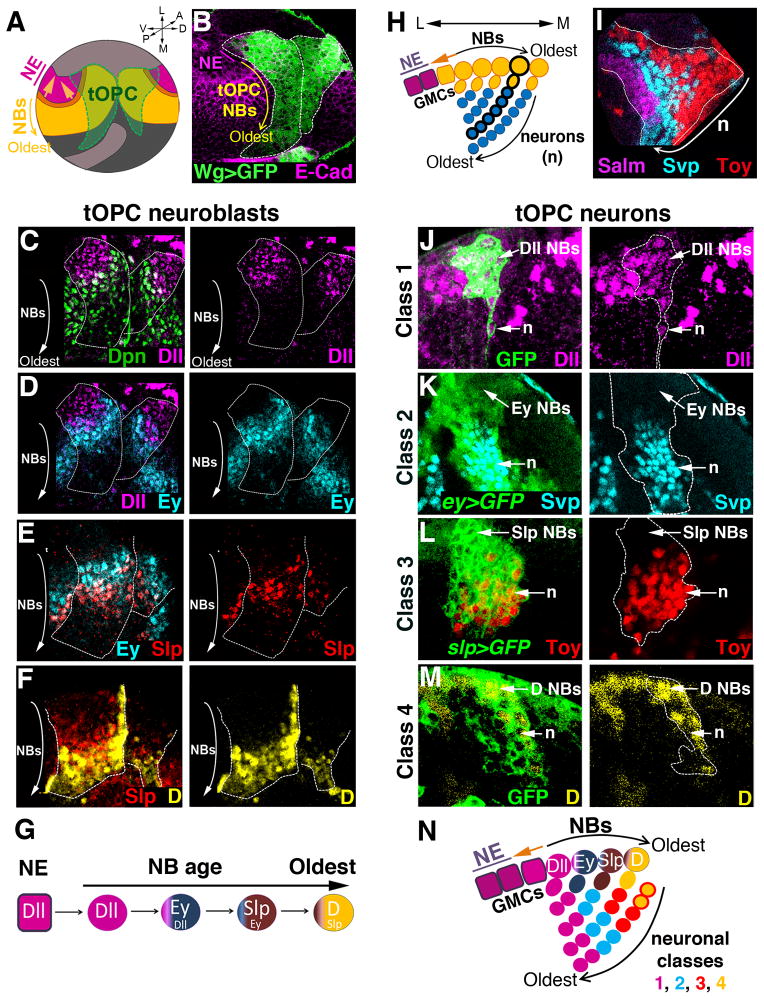
Figure 1. The tOPC temporal series sequentially produces four neuronal classes.
Unless specified, all pictures are posterior views of third instar larvae (L3). A, Model of a larval optic lobe showing that a wave of neurogenesis (orange) converts OPC neuroepithelial cells (NE, purple) into neuroblasts (NBs, yellow). The tOPC is defined by wg-gal4 expression (green). A, anterior; P, posterior; V, ventral; D, dorsal; L, lateral; M, medial. B, The tOPC region (wg>GFP, green, dashed lines). E-Cad stains the neuroepithelium (purple). C–G, tOPC neuroblasts sequentially express Dll (magenta in C, D), Ey (cyan in D, E), Slp (red in E, F) and D (yellow in F). White dashed lines show the tOPC. H, Model of a cross-section showing neuroblasts (yellow circles), GMCs (yellow) and neurons (cyan). A single neuroblast clone is shown with black thick outlines. I, Cross-section view showing the clustered organization of three of the four medulla neuronal classes: Class 1 (Salm, magenta), Class 2 (Svp, cyan) and Class 3 (Toy, red). J, Cross-section view. Early neuroblast clone (GFP, dashed lines) showing that Dll (magenta) is transmitted from neuroblasts (NBs) to neurons (n). K, Perduring GFP driven by ey-gal4 (dashed lines) is expressed in almost all Svp neurons (cyan). L, GFP driven by slp-gal4 (dashed lines) is expressed in all Toy neurons (red). M, Cross section view. Late neuroblast clone (dashed lines) showing that D expression (yellow) is transmitted to the neurons. N, Schematic model of tOPC neurogenesis. Only one neuroblast/GMC is shown for each stage. See also Figure S1.

