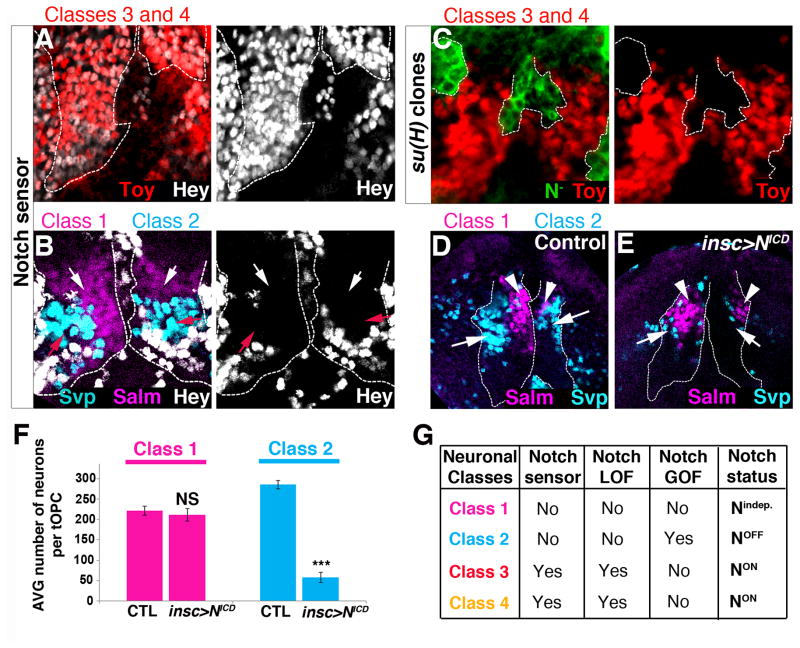
Figure 2. Notch status of tOPC neurons.
Posterior views of L3 optic lobes. A, B, Hey (white) is expressed by Class 3 Toy and Class 4 Toy/D neurons (A) but not by Class 1 Salm/Runt (magenta, white arrows) and Class 2 Svp (cyan, red arrows) neurons (B). Dashed lines indicate the tOPC. C, Class 3 Toy and Class 4 Toy/D neurons (red) are lost in su(H) mutant clones (GFP, dashed lines). D, Control brains showing Class 1 Salm/Runt (magenta, arrowheads) and Class 2 Svp (cyan, arrows) neurons. E, Ectopic Notch signaling (insc>NICD) leads to the loss of Class 2 Svp neurons (cyan, arrows) but has no effect on Class 1 Salm/Runt neurons (magenta, arrowheads). Dashed lines indicate the tOPC. F, Average number of tOPC neurons in control and Notch gain-of-function (N=7 brains/genotype). Magenta=Class 1 Salm/Runt neurons, Cyan=Class 2 Svp neurons. All data represent mean ± s.d. NS, not significant. *** P<0.001. G, Summary. See also Figure S2.

