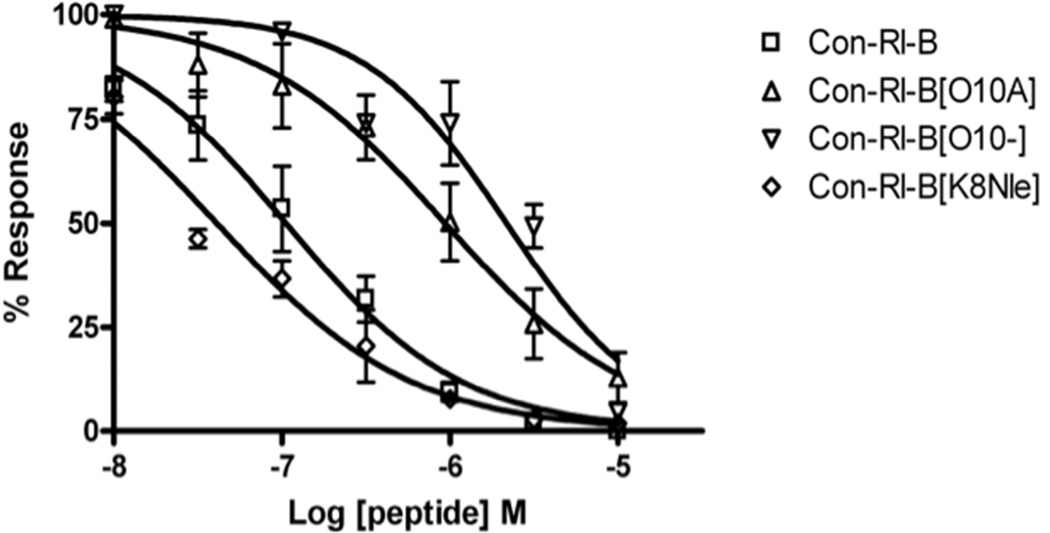
Figure 4.
Concentration response curves of ConRl-B analogs on NR2B/NR1-2b, compared to native ConRl-B. Potency is decreased by O10A and O10-, but not by K8Nle. Sequences of ConRl-B and variants are shown in Figure 3. Each data point represents the average peak current, normalized to baseline from a minimum of three oocytes. Error bars represent SEM.

