
Figure 4.
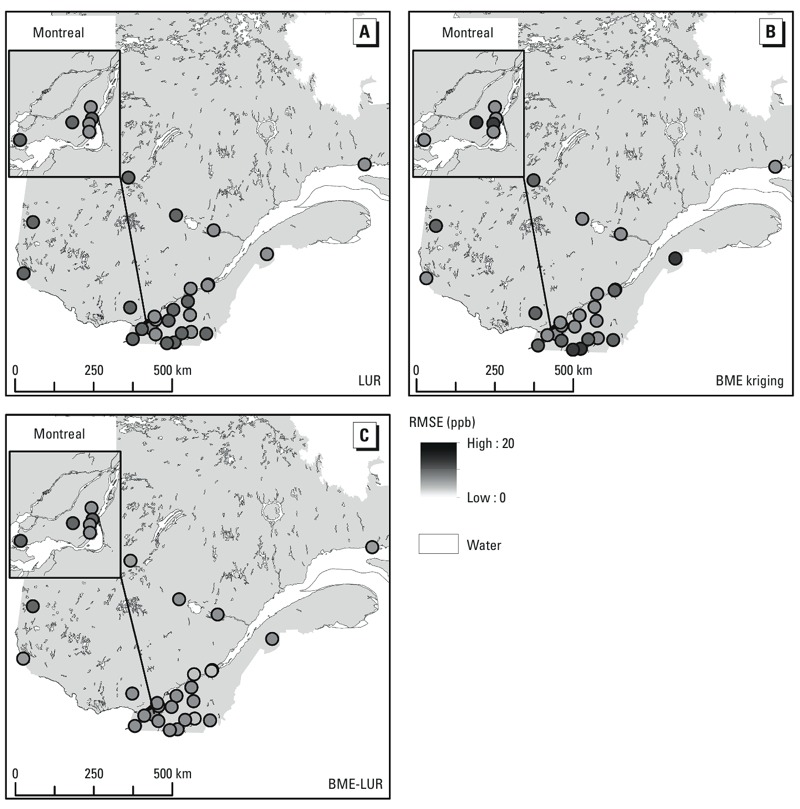
Spatial distribution of mean O3 error estimates (RMSEs) in the study area (year 2005) based on the leave-one-station-out cross-validation for LUR (A), BME kriging (B), and BME-LUR (C) models.
Official websites use .gov
A
.gov website belongs to an official
government organization in the United States.
Secure .gov websites use HTTPS
A lock (
) or https:// means you've safely
connected to the .gov website. Share sensitive
information only on official, secure websites.
Spatial distribution of mean O3 error estimates (RMSEs) in the study area (year 2005) based on the leave-one-station-out cross-validation for LUR (A), BME kriging (B), and BME-LUR (C) models.