
Figure 5.
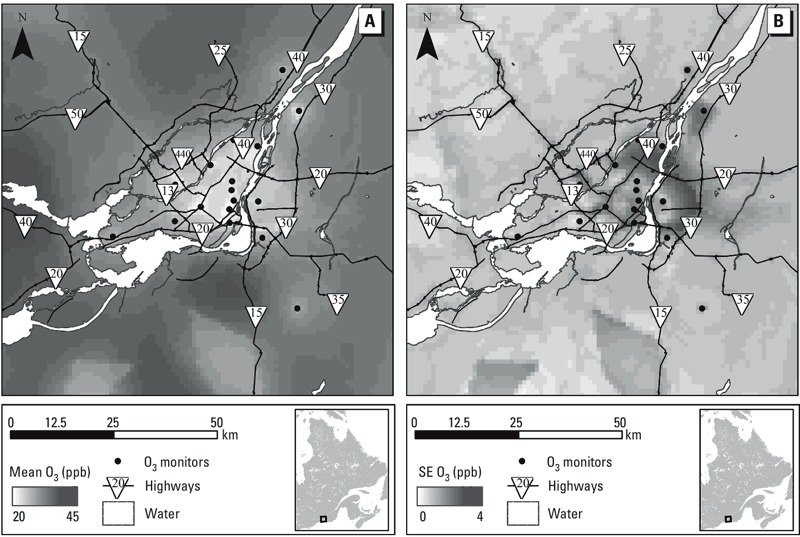
Mean O3 levels (0900–1700 hours) (A) and SEs (B) predicted from the BME-LUR at a 1-km grid across the greater Montreal region in Quebec (Canada) for the summers of 2006–2009.
Official websites use .gov
A
.gov website belongs to an official
government organization in the United States.
Secure .gov websites use HTTPS
A lock (
) or https:// means you've safely
connected to the .gov website. Share sensitive
information only on official, secure websites.
Mean O3 levels (0900–1700 hours) (A) and SEs (B) predicted from the BME-LUR at a 1-km grid across the greater Montreal region in Quebec (Canada) for the summers of 2006–2009.