
Figure 3.
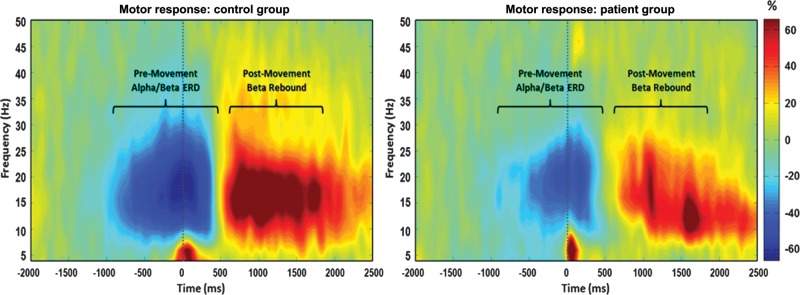
Average time–frequency spectra in controls and patients with PD during movement. Time (in ms) is denoted on the x-axis, with 0 ms defined as movement onset. Frequency (in Hz) is shown on the y-axis. The average patterns of alpha and beta premovement desynchronization and PMBR during the hand movement task, expressed as percent difference from baseline, are shown in the control group on the left. The reduced alpha and beta desynchronizations, as well as a diminished beta rebound in the same region, can be discerned in the PD group average on the right. In addition, the lower-frequency gamma response that occurred at movement onset can be seen in the average plot of the patients with PD. This gamma response was present in a subset of patients and controls (see Supplementary Data).