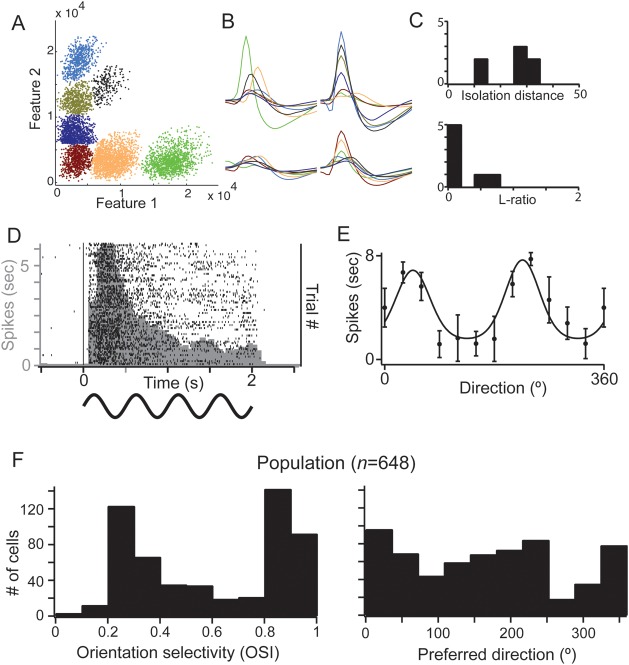
Figure 1.
Characterization of simultaneously recorded small population in mouse V1. (A and B) Example for the separation of spiking activity on a single tetrode into single-cell clusters. (A) Spikes from the tetrode, plotted in feature space, and color-coded by cluster assignment. Features 1 and 2 correspond to the waveform peak values on 2 contacts, shown in the top row of B. Nonclustered spikes have been removed. (B) Average waveform values on each contact for each cluster shown in A. (C) Spike cluster metrics, isolation distance, and L-ratio, from the example data. (D and E) Representative response from a single cell in L2/3 of mouse V1. (D) Peristimulus time histogram and (E) orientation tuning. (F) Orientation tuning parameters across the population of recorded neurons. In this and all subsequent figures, error bars are standard error of the mean.

