Figure 2.
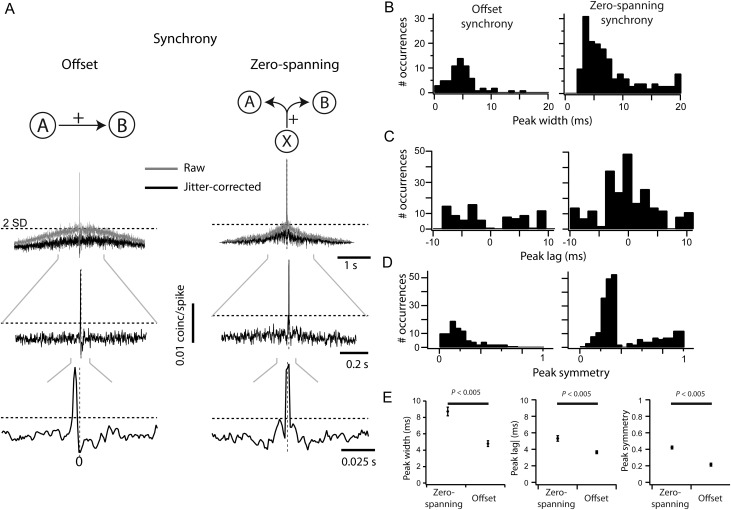
Quantification of pairwise correlation. (A) Measuring and classifying synchrony from CCGs. Raw CCGs (gray) were corrected using a 50-ms jitter-correction term. A threshold (dashed lines) was set 2SD above mean in the 100- to 200-ms range of each CCG. Any peak above this threshold within 10 ms of zero was classified as positive; positive peaks were classified as either offset if the entire peak was offset from zero (A, left) or zero-spanning otherwise (A, right). (B) The distributions of peak widths for each CCG class, where peak width is measured at the crossing of the significance threshold. (C) The distributions of peak lag for each class of CCG, where peak lag is measured as the time of peak relative to time zero. (D) The distributions of peak symmetry for each class of CCG, where peak symmetry is measured as the magnitude of peak at time zero relative to the peak magnitude. (E) Comparison of the mean peak width, absolute peak lag, and peak symmetry between CCG classes.

