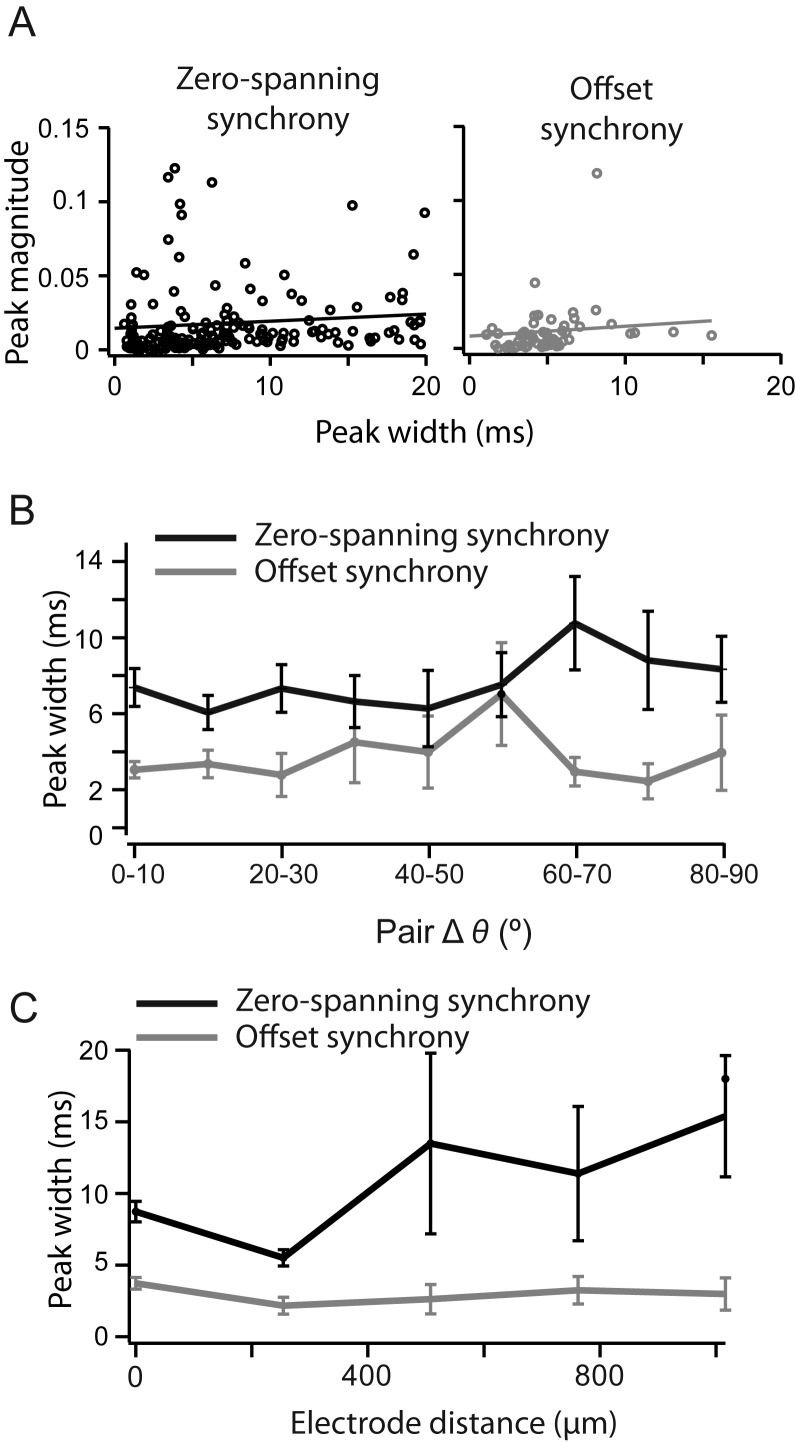
FIgure 6.
Offset synchrony width is narrower than zero-spanning synchrony. (A) Cross-correlation magnitude measured as a function of peak width for zero-spanning (black, left) and direct synchrony (gray, right). (B) Width of CCG peaks, measured at the threshold crossing, as a function of distance between cells for offset (gray trace) and zero-spanning synchrony (black trace). (C) The width of CCG peaks as a function difference in preferred orientation for offset (gray trace) and zero-spanning synchrony (black trace).

