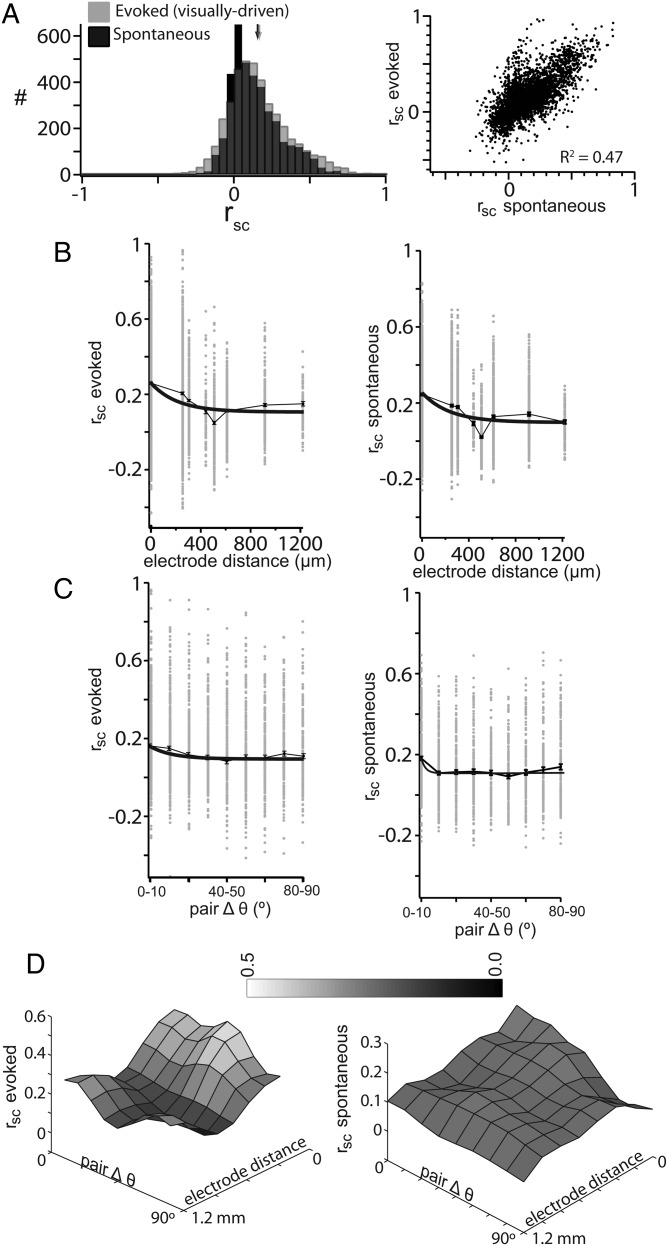
Figure 8.
The structure of correlated variability across distance and orientation preference. (A) Distributions of evoked (gray) and spontaneous (black) rsc were nonzero (left). Evoked rsc was positively correlated with spontaneous rsc (right). (B) Evoked and spontaneous, rsc, decayed with distance between a pair of cells. (C) Evoked and spontaneous, rsc, was dependent on the difference in orientation preference between a pair of cells. (D) Spontaneous and evoked, rsc, have a stronger dependence on Δθ at smaller distances.

