
Figure 6.
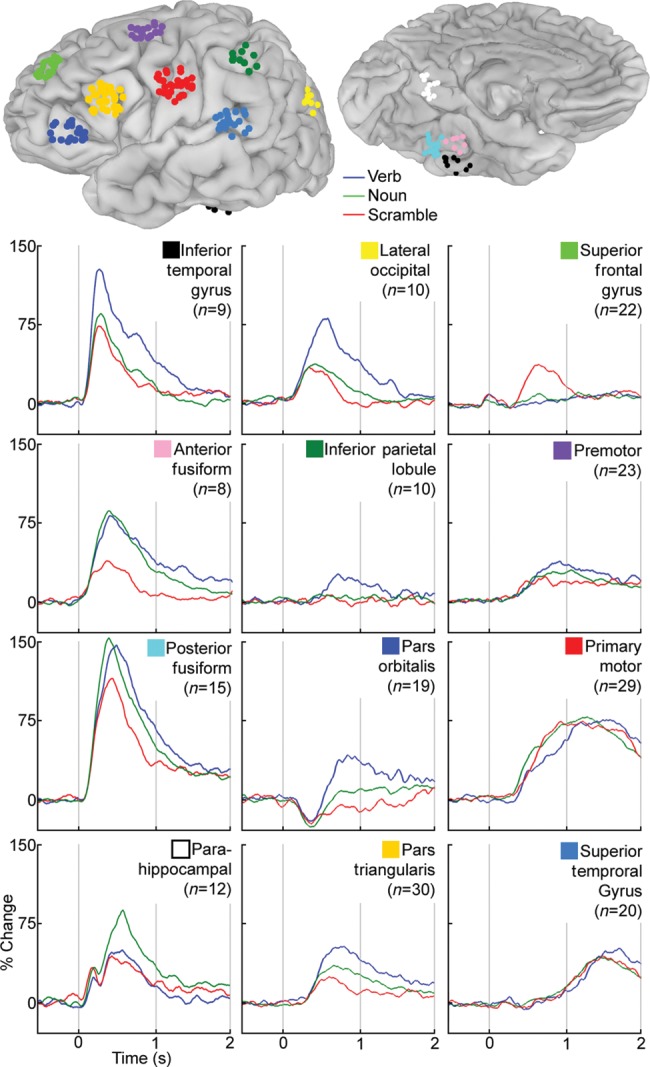
Average time series for regions with significant activation. SDEs within 8 mm of the center of mass of significant activations for verb versus scramble or noun versus scramble using 3D MEMA (Fig. 3) were selected. The percent change in the mid-gamma band (60–120 Hz) over prestimulus baseline was calculated and averaged for these electrodes in these 12 regions. The location of all electrodes in these regions is shown on the MNI-N27 brain surface (coordinates in Table 1).