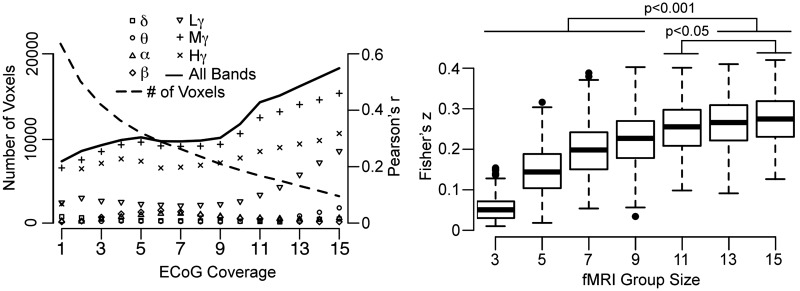
Figure 8.
Correlation of fMRI and ECoG results. (Left) Voxel-wise correlation of ECoG and fMRI MEMA of verb versus noun for each frequency band, carried out by varying the number of subjects with ECoG coverage (Fig. 2). (Right) A bootstrap analysis for different fMRI group sizes subjected to the same voxel-wise comparison as above (coverage ≥10 subjects, 500 resamples at each group size). Comparisons of different groups were performed using a 2-sided sign test (Bonferroni corrected) to determine the optimal number of subjects for group fMRI analysis. The optimal group size lies between 11 and 15.

