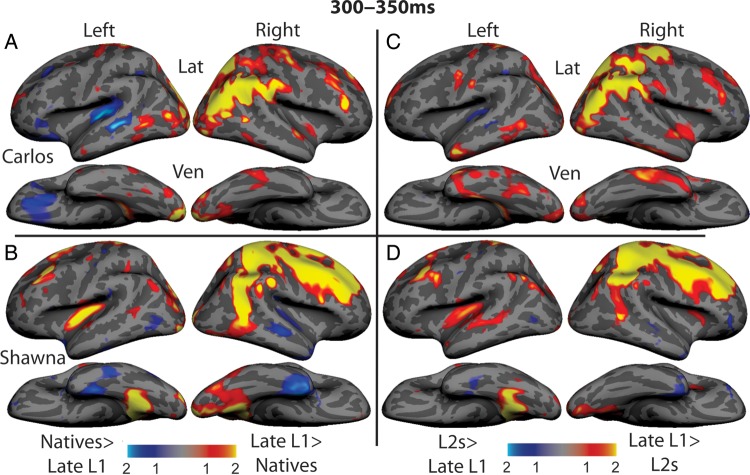
Figure 3.
Z-score maps showing brain areas where semantic modulation is greater in the 2 cases compared with the control groups (yellow and red) and areas where semantic modulation is greater in the control groups compared with the 2 cases (blue) (A) Carlos versus native signers, (B) Shawna versus native signers, (C) Carlos versus L2 signers, and (D) Shawna versus L2 signers. The cases exhibit stronger activity than the control participants predominantly in the right-hemisphere parietal cortex, with additional areas in the right occipital cortex (Carlos) and right frontal cortex (Shawna).

