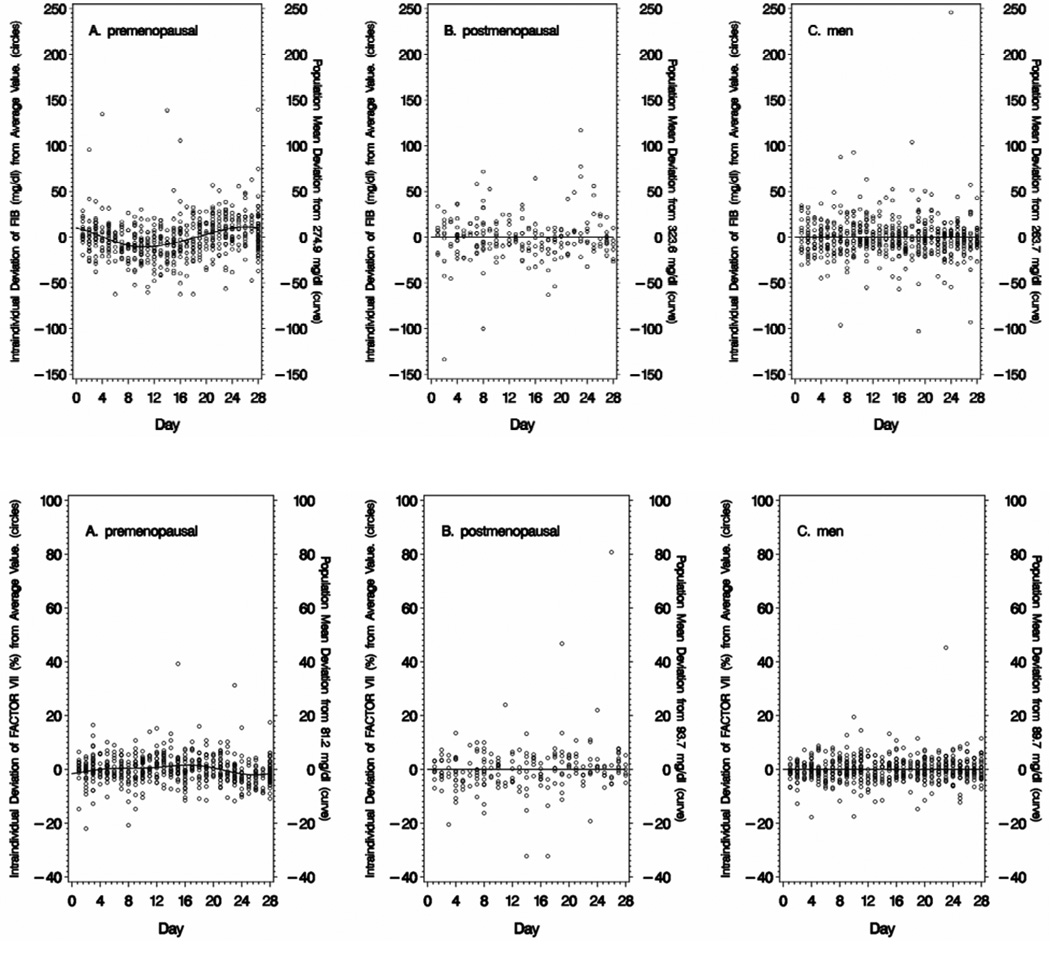
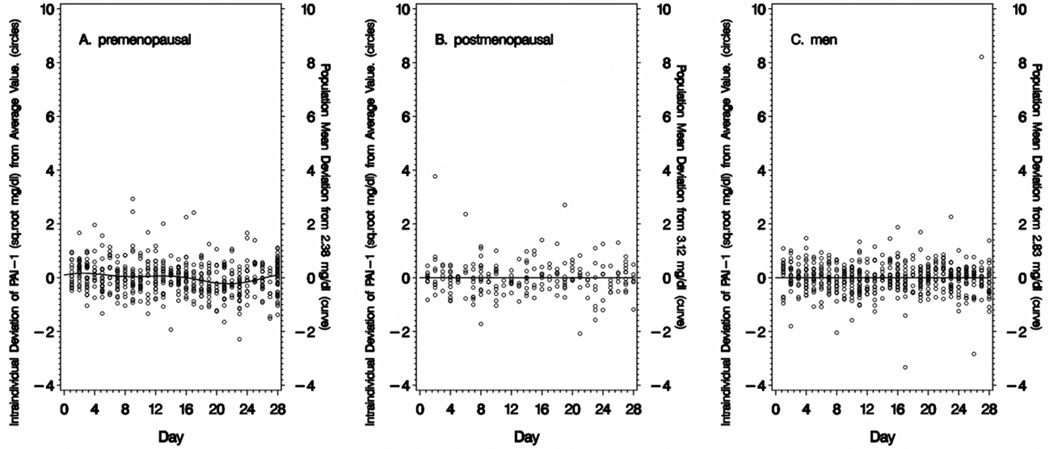
Figure 2. Variability of Fibrinogen (FIB), Factor VII and Plasminogen Activator Inhibitor-1 (PAI-1) over 28-Days.
Data is displayed as deviation from a reference value. The curve or line represents the deviation of the sub-population mean for the analyte at that point in time compared with the overall population mean value for the entire time period (shown on the right y-axis). The circles represent the deviation of a single measurement of fibrinogen (FIB), factor VII or plasminogen activator inhibitor (PAI-1) for an individual from the overall mean value for that individual. Intraindividual variations are computed independently for each diet period. For premenopausal women (Panel A), the first day of menses was the index day - based on self-reported menstrual calendar and confirmed by hormone concentrations (estradiol, progesterone, luteinizing hormone). For postmenopausal women (Panel B) and men (Panel C) the index day was randomly selected for each subject.


