
Figure 2. Multivariate adjusted smoothing spline plots showing the hazard ratios for dementia and Alzheimer disease by serum 25(OH)D concentrations.
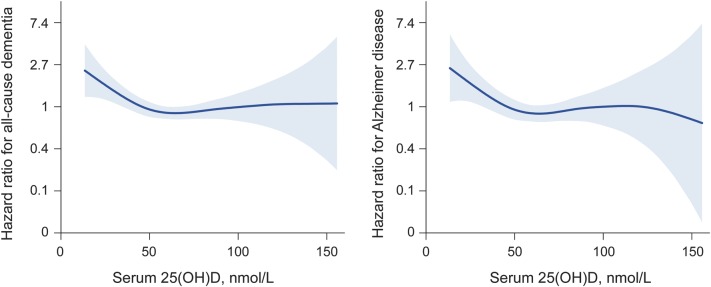
Models adjusted for age, season of vitamin D collection, education, sex, body mass index, smoking, alcohol consumption, and depressive symptoms. Hazard ratios centered on median serum 25-hydroxyvitamin D (25(OH)D) concentrations.