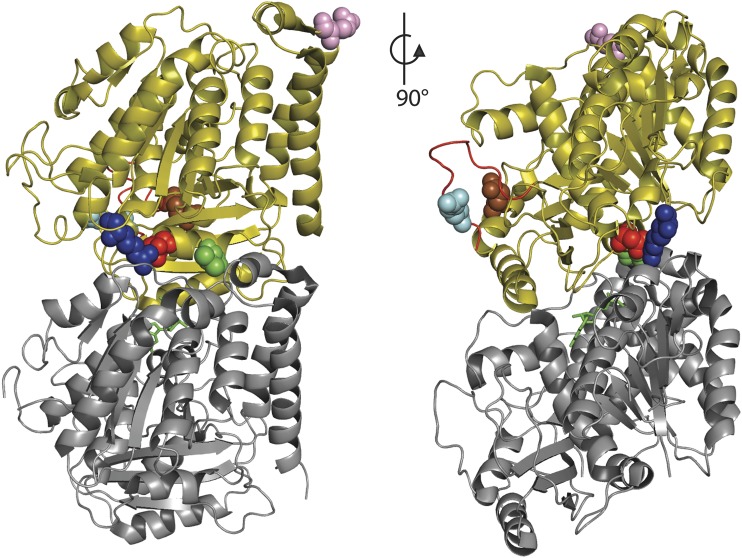
Figure 2. Structure of the αβ-tubulin heterodimer.
α-Tubulin is shown in gray, β-tubulin is olive, and the GTP (guanosine triphosphate) at the intradimer interface is shown in green. Each mutant residue is shown as spheres; R2 (blue), V255 (green), D249 (red), R282 (cyan), Q292 (brown), and R391 (pink). The M-loop region of β-tubulin is highlighted in red.

