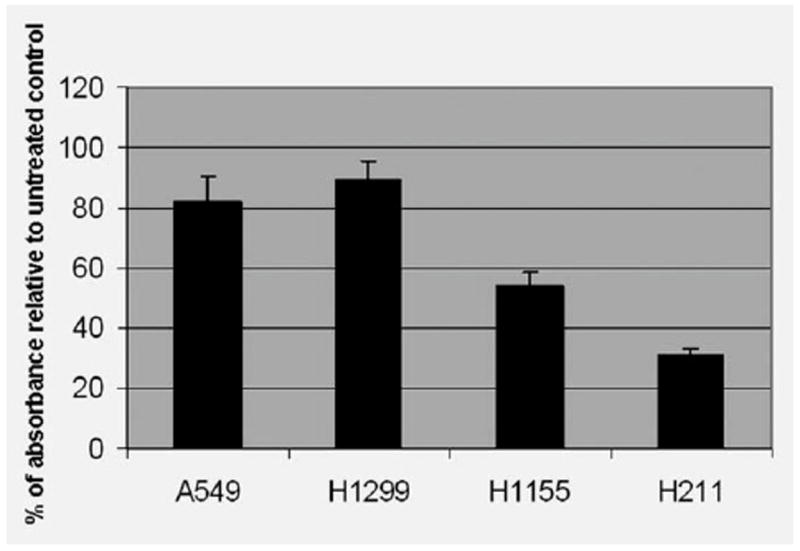
Figure 1.

Analysis of cell viability post PRIMA-1 treatment. Cells were treated with the PRIMA-1 (100 μM), and the MTT assay was performed to determine cell viability 24 hr posttreatment. Each treatment was repeated in quadruplicate. An averaged absorbance of blank values (with no cells) was subtracted from all absorbance to yield corrected absorbance. The relative absorbance of each sample was calculated by comparing the average of corrected absorbance with an average of corrected untreated control. Each value presented in this figure was an average value obtained from 4 measurements.
