
Figure 1.
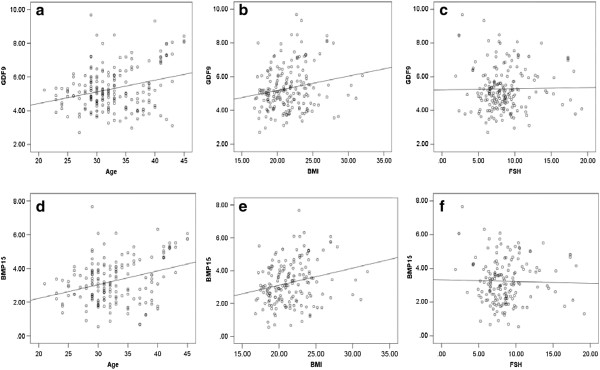
Pearson analysis was used to analyze the correlation between GDF9 and BMP15 expression and general parameters in 196 patients who underwent ICSI. The numbers on the horizzontal-axes refer to the age, BMI, and FSH. The numbers on the y longitudinal axes refer to the relative mRNA expression of GDF9 or BMP15. (a) The correlation between age and the relative expression of GDF9 mRNA. (b) The correlation between BMI and the relative expression of GDF9 mRNA. (c) The correlation between FSH and the relative expression of GDF9 mRNA. (d) The correlation between age and the relative expression of BMP15 mRNA. (e) The correlation between BMI and the relative expression of BMP15 mRNA. (f) The correlation between FSH and the relative expression of BMP15 mRNA.