
Figure 2.
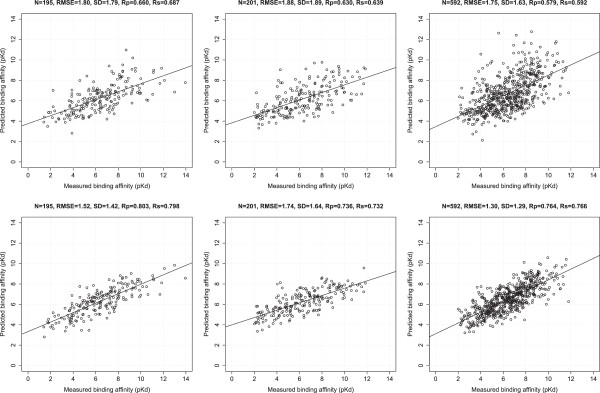
Correlation plots of predicted binding affinities against measured ones. Top row: Cyscore. Bottom row: RF::CyscoreVinaElem. Left column: PDBbind v2007 benchmark (N = 195), with RF::CyscoreVinaElem trained on 1105 complexes. Center column: PDBbind v2012 benchmark (N = 201), with RF::CyscoreVinaElem trained on 2696 complexes. Right column: PDBbind v2013 round-robin benchmark (N = 592), with RF::CyscoreVinaElem trained on 2367 complexes.