


Figure 2.
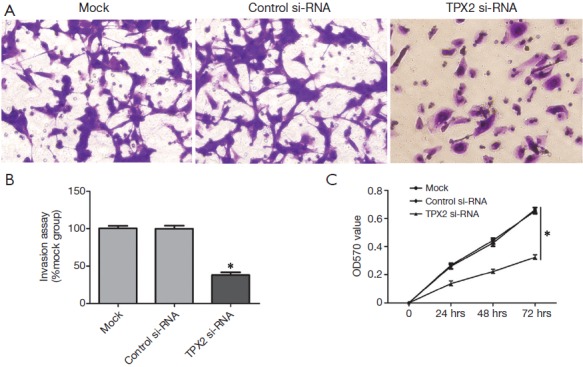
TPX2 knockdown suppressed invasion and proliferation of SMMC-7721 cells. (A) Representative images show invasion of SMMC-7721 cells transfected with TPX2-siRNA, siRNA (control-siRNA), or lipofectamine alone (mock) in a transwell assay (200×); (B) data are presented as mean relative numbers of invasion cells from 5 fields. Values are depict as Mean ± SEM, n=3. (*P<0.05, vs. control-siRNA group); (C) cell proliferation curve was measured by MTT assay. Each point indicates the mean of the spectrometric absorbance. Values are depict as Mean ± SEM, n=3. (*P<0.05, vs. control-siRNA group).