
Figure 3.
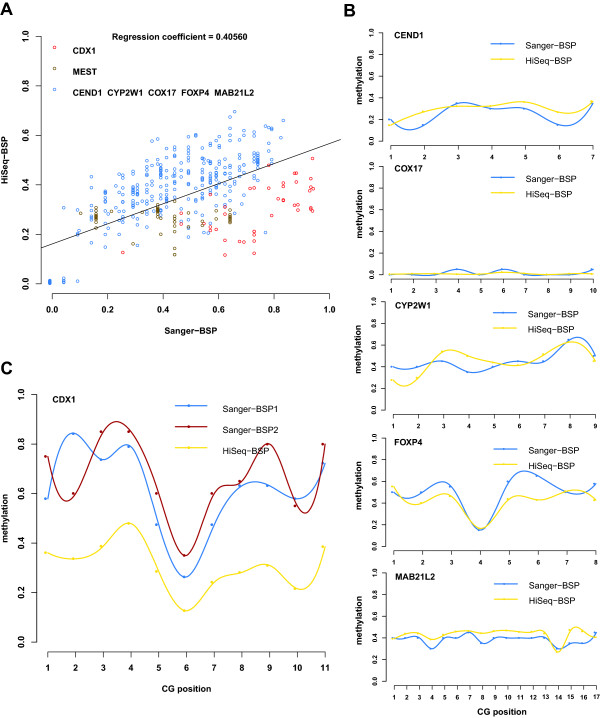
BSP combined with high-throughput HiSeq sequencing for methylation validation. (A) Scatter plots of the average DNA methylation level of all CpG sites covered by both HiSeq-BSP (X-axis) and Sanger-BSP (Y-axis), with each plot indicating a CpG site. A regression line is added and the regression coefficient is indicated. (B) Examples of DMR in the promoter of five genes (CEND1, COX17, CYP2W1, FOXP4 and MAB21L2) with general consistency for methylation levels detected by HiSeq-BSP and Sanger-BSP. (C) An example of DMR in the promoters of CDX1 with greater variability of methylation levels detected by HiSeq-BSP and Sanger-BSP