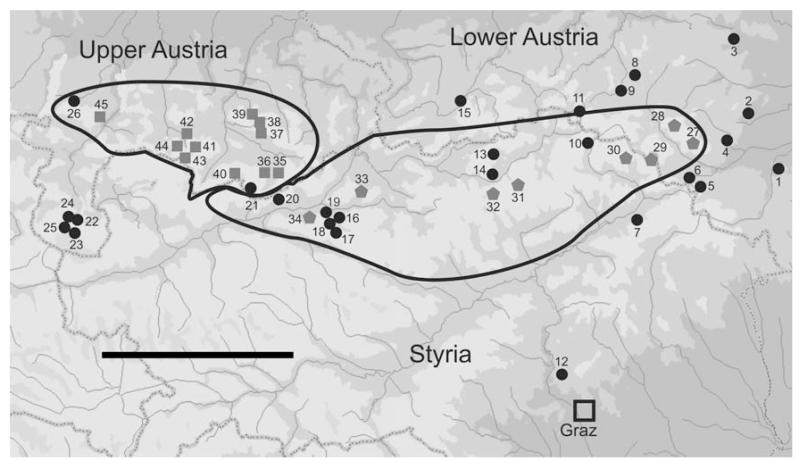
Figure 2.
Sample localities: Trochulus o. oreinos, grey pentagons; T. o. scheerpeltzi, grey squares; T. hispidus, black circles. Numbers correspond to localities in Table 1. Distribution ranges of T. o. oreinos and T. o. scheerpeltzi (according to Klemm, 1974) are delineated with black lines. The scale bar represents 50 km.

