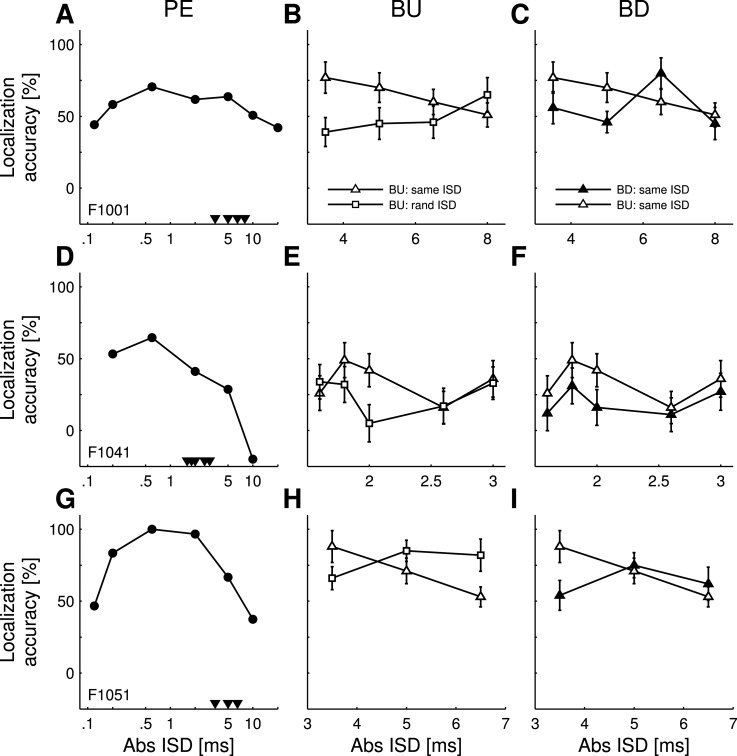
FIG. 5.
Three ferrets (rows) were tested for the PE (left column) as well as its buildup (BU, middle and right column) and breakdown (BD, right column). Arrowheads in the left column mark the |ISDs| that were tested in the experiment investigating BU/BD. In some trials, the target sound pair was preceded by a conditioning train of nine paired sounds with either the same (“BU: same ISD”) or the same but sign-inverted (“BD: same ISD”) ISD as in the target sound pair (triangles). In other, control trials, the target sound pair was preceded by nine paired sounds in the same lead/lag presentation order but with random ISDs that excluded that of the target sound pair (squares; “BU: rand ISD”). Error bars show the SEM derived from bootstrapping by calculating the localization accuracy from 1000 resamples of the original responses.

