
Figure 3.
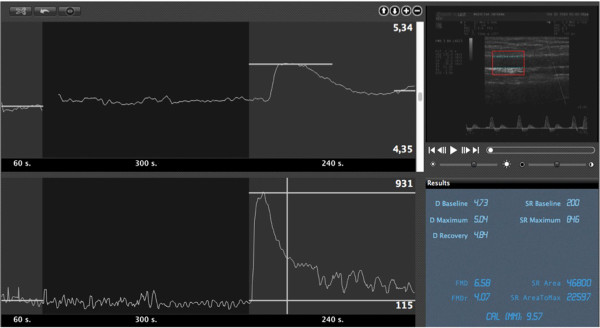
Example of automatic edge detection and real-time analysis of B-mode and doppler signal during flow mediated dilation (FMD) assessment (top right). Graphs show changes in brachial artery diameter diameter (D, top panel) and shear rate (SR, left). The panel on bottom left reports mean baseline, maximun) values of D and SR, and the computation of FMD.