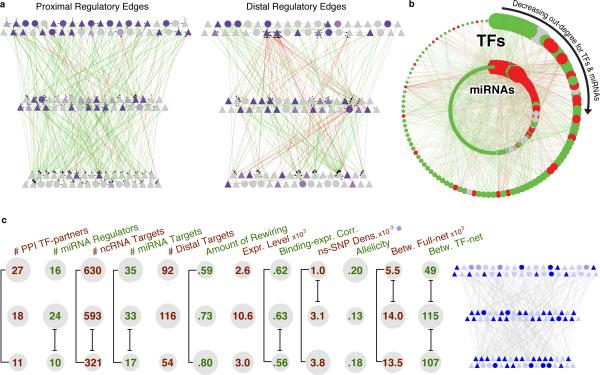
Figure 2. Overall Network.
(a) Close-up of the TF hierarchy. The nodes depict the TFs: TFSSs are triangles, and non-TFSSs are circles. At the left we show the proximal-edge hierarchy with downward pointing edges colored in green, and upward pointing ones colored in red. The nodes are shaded according to their out-degree in the full network (as described in Table 1). The right part shows the TFs placed in the same proximal hierarchy but now with edges corresponding to distal regulation colored green and red, and nodes recolored according to out-degree in the distal network. We see that the distal edges do not follow the proximal-edge hierarchy.
(b) Close-up of TF-miRNA regulation. The outer circle contains the 119 TFs, while the inner circle contains miRNAs. Red edges correspond to miRNAs regulating TFs; green ones, TFs regulating miRNAs. TFs and miRNAs each are arranged by their out-degree, beginning at 12 o'clock and decreasing in order clock-wise. Node sizes are proportional to out-degree. For TFs, the out-degree is as described in Table 1; for miRNAs, it is according to the out-degree in this network. Red nodes are enriched for miRNA-TF edges and green nodes are enriched for TF-miRNA edges. Gray nodes have a balanced number of edges (within ±1).
(c) Average values of various properties (topological, dynamic, expression-related, and selection-related -ordered consistently with Table 1) for each level are shown for the proximal-edge hierarchy. The top, middle, and bottom rows correspond to the top, middle, and bottom of the hierarchy, respectively. The sizing of the grey circles indicate the relative ordering of the values for the three levels. Significantly different values (P<0.05) using the Wilcoxon-rank-sum test are indicated by black brackets. The proximal-edge hierarchy depicted on the right shows non-synonymous SNP density, where the shading corresponds to the density for the associated TF.
(More details in Fig S4.)

